
Dashboard for Cloud Custodian
An alternate method to get the visuals and build your own dashboards
After using the Cloud Custodian for over four years, we can all agree to have missed one prominent feature that is “Dashboard”. Cloud Custodian does not have the front end / GUI where you can easily navigate the findings, provide a single plane of glass view of all the accounts you have from all of the public cloud providers, show checks on policy health, display various charts, and guidance to tell the story to the management. Due to this shortcoming, the user has to integrate with native tools or third-party tools. We know how powerful is the Cloud Custodian with all the execution modes, filters, and action items. The fact that it is serverless, running Cloud Custodian is very cheap. Every organization's environment is different and so is the configuration, simply stating the monthly cost to run 200 policies (approx.) is less than $100 (depends on how frequently you are running).
Cloud Custodian is an open-source python based serverless tool
In this story, I will go through the high-level architecture of the Cloud Custodian and Sumo Logic setup which enables us to ingest the Custodian Logs and write various queries to look for non-compliant items, check for policy health, and draw pretty dashboards.
Example- Identify AWS Redshift Cluster Publicly Accessiblepolicies:
- name: redshift-cluster-publicly-accessible
resource: aws.redshift
comments: |
Find Redshift clusters that are publicly accessible.This is a
notify only policy. The policy run once every 24 hours.
filters:
- "tag:redshift-publicly-accessible-exempt": absent
- PubliclyAccessible: true
mode:
type: periodic
schedule: "rate(24 hours)"
execution-options:
output_dir: s3://s3bucket/cclogs/{account_id}/
runtime: python3.8
action:
- type: deleteDifferent Components
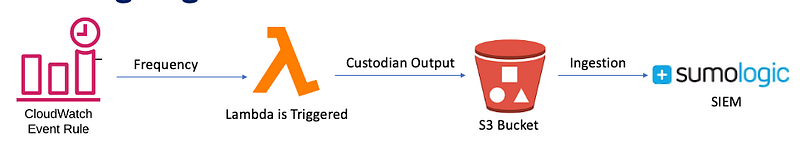
The basic component of Cloud Custodian depending on your implementation includes — Lambda Function, CloudWatch Log Groups, and Cloud Watch Event Rules. Firstly, you write a policy in YAML as shown above, as an example to identify the publicly accessible Redshift clusters. When you deploy the policy to the AWS account, the real magic happens. It creates the lambda function which includes the policy. It will then create the CloudWatch Log Groups. This is where you can check the log streams. Every time the policy runs it creates a new log stream. This log stream contains the timestamp and debugging messages. You can also see if the resources matched the filters and identified them as non-compliant items. Lastly, it creates the Cloud Watch Event Rule. This is where you can check how often the policy will run. It includes the event rule name, status, event schedule, and target. I have a separate story where I have discussed how to solve the quota problem for cloud watch event rules while deploying the cloud custodian policies.
Architecture
A high-level architecture includes the Lambda function where the Custodian and the policy reside. The Cloud Watch event rule will trigger the policy to execute. Custodian will look for the items matched to the filter and produces the output in GZ format. This output is sent to the s3 bucket as defined in the policy. The IAM role that is used by Custodian must have access to that s3 bucket in order to drop those files. You must have deployed the hosted collector within that AWS account to ingest the Custodian output logs from s3 (3 GZ files) into the Sumo Logic (SIEM solution).
SumoLogic
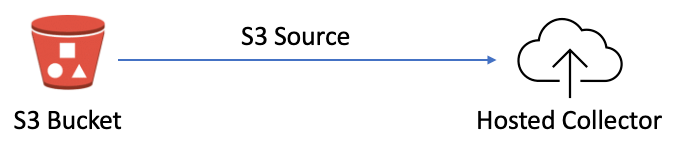
Sumo Logic is a cloud-based SIEM solution(Security Information and Event Management). A hosted collector must be configured for Source S3. This means a hosted collector will take the data from the s3 bucket and ingest it into SumoLogic. Refer to the SumoLogic support page for instructions on how to create the collector and source.
We have a separate story that explains the components required and corresponding configurations. Refer to the story- Ingesting Cloud Custodian Logs into SumoLoigc (Part 1) and Ingesting Cloud Custodian Logs into SumoLoigc (Part 2). A separate story to identify the Cloud Custodian Policy Health Checks.
Dashboard
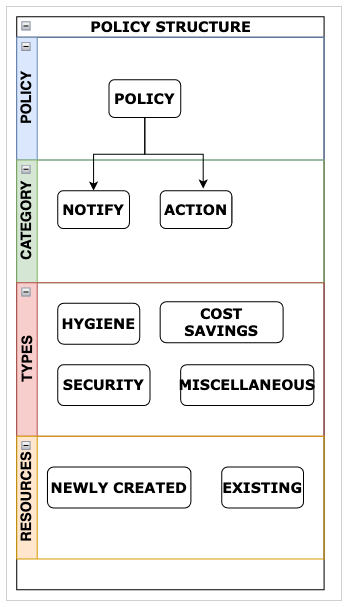
We have created the below dashboard to give a high-level counts on various things- 1) Total number of AWS accounts 2) Count of low and high tier accounts 3) Count on active and suspended accounts 4) Total number of CIS Benchmark Policies 5) Total number of Cost Saving Policies (Separation into Action Vs Notify) 6) Total number of Security Related Policies, etc.
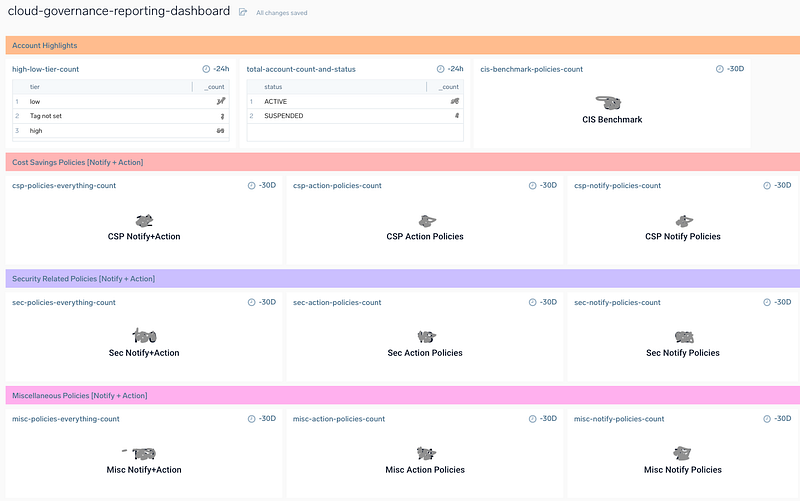
In order to get these counts, it is very important that you have the policy to count the resources. In this scenario, we are using the policy that is counting on lambda functions. We have also adopted a simplified naming convention which allows us to identify- (i) if the policy is CSP (cost-saving policy) or Sec (security-related) or misc (miscellaneous (ii) if the policy is to notify only (indicated as -n-) or action (indicated as -na-) (iii) acts on existing or newly created resources. The below policy structure shows the
In the below query, you have to enter your _sourceCategory, _sourceName. The policy name that counts the lambda function is “sec-n-lambda-function-count”. We have to use regex to separate the FunctionName that matches with “cis-” because the CIS benchmark policies start with “cis’”
_sourceCategory="aws/cc/sourcecategory" AND _sourceName=*CustodianLogs/*/policyname/*/*/*/*/resources.json.gz
| parse field=_sourceName "*/*/*/*/*/*/*/*" as clogs, account_id, policies_name, year, month, date, _min, crunlog nodrop
| parse regex "\"FunctionName\":\s\"(?<FunctionName>.+?)\"" multi nodrop
| where FunctionName matches "*cis-*"
| count(FunctionName) group by FunctionName
| fields -_count
| count
The below screenshot from the Sumo Logic dashboard shows — 1) Total number of policies related to missing tags for existing resources (covers all existing) and 2) Total number of policies related to missing tags for newly created resources (in the past 30 days). It is important to note that you have to write individual policies for each resource to count the resources. 3) It also gives the count of policies related to encryption. For example- the number of policies related to encryption that has guard rails, the number of policies that are just notified only, and the number of policies that covers CIS benchmarks (related to encryption).
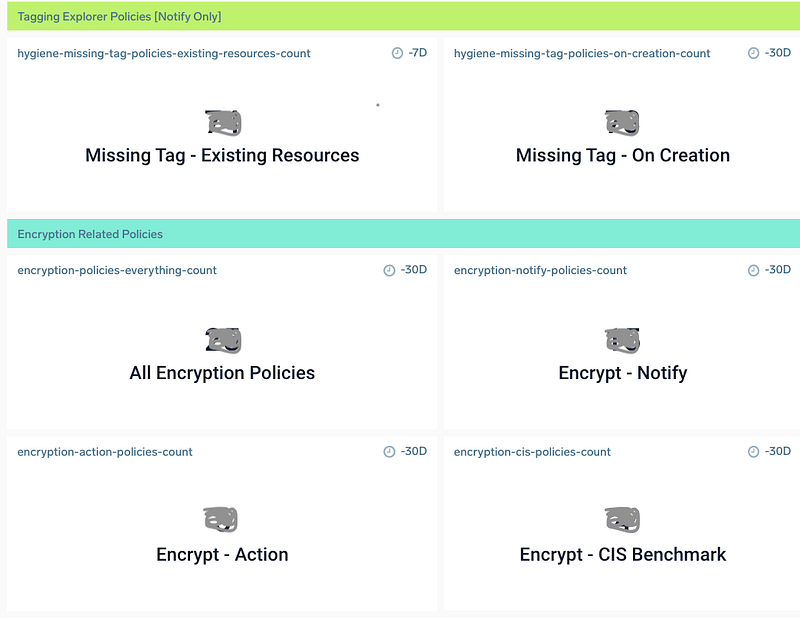
Encryption Related Policies — Dashboard
This dashboard contains all the resources that have policies related to encryption. For example, the policies are looking where encryption is not enabled and then notifying it, in other cases where it has a guard rails and taking actions. This provides you with a quick way to identify all non-compliant items.
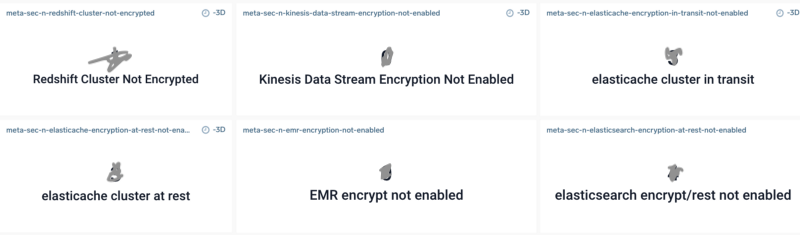
A sample Sumo Logic query to draw the dashboard like above. Replace the below query with source category, source, source name, collector, and policy name.
Sumo Logic Query
_sourceCategory="source-category" and
_source="resources_file_sourcename" and _collector="collectorname"
AND _sourceName=*cclogs/*/sec-n-redshift-cluster-not-encrypted/*/*/*/*/resources.json.gz
| parse field=_sourceName "*/*/*/*/*/*/*/*" as clogs, account_id, policies_name, year, month, date, _min, crunlog nodrop
| parse regex "\"ClusterIdentifier\":\s\"(?<ClusterIdentifier>.+?)\"" multi nodrop
| count (ClusterIdentifier) group by ClusterIdentifier, account_id
| fields -_count
Publicly Accessible Resources — Dashboard
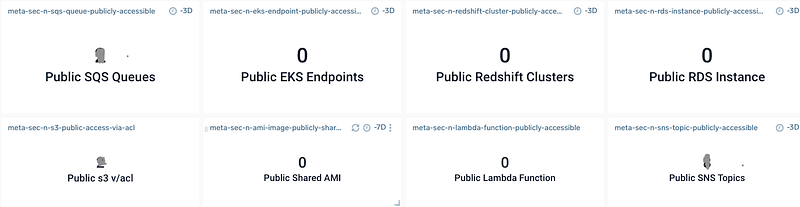
The below screenshot shows the dashboard for resources that are exposed to the world. You have to write each individual query in Sumo Logic and then add it to the dashboard.
Comparing Historical Data
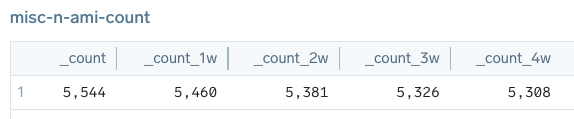
Example#1 — In the below example, we are comparing historical data to understand how many AMIs existed and were created in the last 4 weeks across all of your AWS accounts (hundreds).
*** Sumo Logic Query ***
_sourceCategory="YourSourceCategory" and
_source="cloudcustodianresourcefilename" and _collector="YourCollector" AND _sourceName=*CustodianLogs/*/policyname/*/*/*/*/resources.json.gz
| parse field=_sourceName "*/*/*/*/*/*/*/*" as clogs, account_id, policies_name, year, month, date, _min, crunlog nodrop
| parse regex "\"ImageId\":\s\"(?<ImageId>.+?)\"" multi nodrop
| count (ImageId) group by ImageId
| count| compare timeshift 1w 4
The below screenshot shows the count of AMIs every week for the last 4 weeks. The data shown is just for illustration purposes only. We have manually edited it to show the differences (historical values).
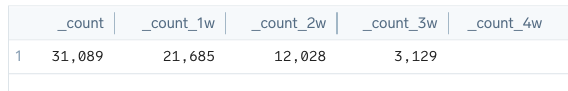
Example #2 — In the below example, we are comparing historical data to understand how many old EBS volume snapshots were deleted in the last 4 weeks across all of your AWS accounts (hundreds).
*** Sumo Logic Query ***
_sourceCategory="YourSourceCategory" and
_source="cloudcustodianresourcefilename" and _collector="YourCollector" AND _sourceName=*CustodianLogs/*/policyname/*/*/*/*/resources.json.gz
| parse field=_sourceName "*/*/*/*/*/*/*/*" as clogs, account_id, policies_name, year, month, date, _min, crunlog nodrop
| parse regex "\"SnapshotId\":\s\"(?<SnapshotId>.+?)\"" multi nodrop
| count (SnapshotId) group by SnapshotId
| count| compare timeshift 1w 4
The below screenshot shows the count of old EBS volume snapshots that were deleted every week for the last 4 weeks. The data shown is just for illustration purposes only. We have manually edited it to show the differences (historical values).
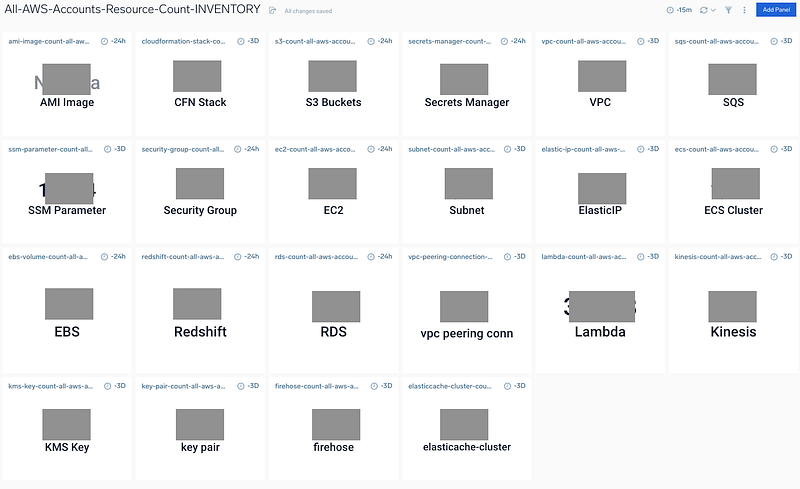
AWS Resources Inventory — Dashboard
We have a separate story where we have discussed the problem and the solution — How to tag at resource and account level in AWS? The below screenshot from sumo provides you with the count of all AWS resources. You can draw a dashboard for each account or for all AWS accounts (100s of accounts together). You just need to adjust your query in Sumo Logic.
Other Stories
Cloud Custodian Policy Health Checks
Ingesting Cloud Custodian Logs into Sumo Logic
Cloud Custodian [GZ] Output Files


