avatarKamran Shahid Butt

Free AI web copilot to create summaries, insights and extended knowledge, download it at here

3969

Abstract

lors, and no axes by default, streamlining the process of plotting vector data. If needed, you can easily customize the appearance using gspatial_plot, Geopandas, or Matplotlib parameters.</p><div id="7f83"><pre>gsp<span class="hljs-selector-class">.shapeplot</span>(usa, figsize=(<span class="hljs-number">15</span>, <span class="hljs-number">15</span>))</pre></div><figure id="5a4f"><img src="https://cdn-images-1.readmedium.com/v2/resize:fit:800/1*hgepISp4blKLRyoMFCcqAg.png"><figcaption></figcaption></figure><p id="970d">You also have the option to adjust the parameters according to your needs. For instance, let’s incorporate a title into the visualization:</p><div id="b7f0"><pre>gsp.shapeplot( usa, title=<span class="hljs-string">"USA MAP"</span>, title_kwds={<span class="hljs-string">"fontsize"</span>: 25, <span class="hljs-string">"fontname"</span>: <span class="hljs-string">"sans-serif"</span>, <span class="hljs-string">"fontweight"</span>: 3}, )</pre></div><figure id="4438"><img src="https://cdn-images-1.readmedium.com/v2/resize:fit:800/1*mIWUUXOP3u1uiZXQs_N2Lg.png"><figcaption></figcaption></figure><p id="1dc8"><b>Here’s the explanation of the shapeplot function’s parameters:</b></p><p id="7d22">• data (GeoDataFrame): GeoDataFrame used as the data source for the map. • title (str): Title displayed on the map. Default is None. • title_kwds (dict): Keyword arguments for configuring title appearance using matplotlib.pyplot.title. Default is an empty dictionary. • figsize (tuple): Dimensions of the figure. Default is (15, 15). • facecolor (str): Background color of the figure. Default is “white”. • edgecolor (str): Color of the map’s edges. Default is “black”. • linewidth (float): Line width for shapes. Default is 0.5. • color (str): Color of the shape. Default is “#F1F3F4”. • annot (bool): Toggle annotations on/off. Default is False. • annot_column (str/GeoDataFrame column): Source column for annotations. Default is None. • annot_align (str): Text alignment for annotations. Default is “center”. • annot_kwds (dict): Keyword arguments for customizing annotations. Default is an empty dictionary. • ax (matplotlib axis): Existing axis for plotting, if needed. Default is None. • axis_on (bool): Toggle axis visibility. Default is False. • **geopandas_plot_kwds: Additional keyword arguments for Geopandas plot customization.</p><p id="5a62">Returns: Matplotlib axis object (ax) representing the map.</p><p id="39a4">This function enables straightforward GeoDataFrame shape plotting with customizable options for appearance and annotations, while allowing flexibility in using existing axes for plotting. The function returns a matplotlib axis object representing the generated map.</p><h1 id="7308">pointplot</h1><p id="e010">Point plot is designed specifically for visualizing point data. A key distinction between point plot and shapeplot lies in the ability to utilize a base vector layer of shapes. This base layer allows points to be plotted on top, enabling a layered representation.</p><div id="62be"><pre>usa_points = usa.representative_point() gsp.pointplot(usa_points, <span class="hljs-keyword">base</span>=usa)</pre></div><figure id="e5d7"><img src="https://cdn-images-1.readmedium.com/v2/resize:fit:800/1*ZOiYi_T2DL9CU9Kx7-KpGA.png"><figcaption></figcaption></figure><p id="6b86">Alternatively, you have the option to plot the polygons themselves instead of just their boundaries in the base layer.</p><div id="aac0"><pre>gsp.pointplot(usa_points, <span class="hljs-keyword">base</span>=usa, base_boundary=False)</pre></div><figure id="3412"><img src="https://cdn-images-1.readmedium.com/v2/resize:fit:800/1*_Sz_IGkazfobhvTpV3Y8Ag.png"><figcaption></figcaption></figure><p id="8f2e">Points can be plotted independently, without the need for a base layer.</p><div id="30aa"><pre>gsp<span class="hljs-selector-class">.pointplot</span>(usa_points)</pre></div><figure id="d8ed"><img src="https://cdn

Options

-images-1.readmedium.com/v2/resize:fit:800/1*zFOL9eUsmS-5S67MeufNcQ.png"><figcaption></figcaption></figure><p id="5c42">Matplotlib axis objects offer the ability to merge and combine multiple plots.</p><div id="4753"><pre>ax = gsp.shapeplot(usa, figsize=(<span class="hljs-number">15</span>, <span class="hljs-number">15</span>)) gsp.pointplot(usa_points, ax=ax)</pre></div><figure id="f05f"><img src="https://cdn-images-1.readmedium.com/v2/resize:fit:800/1*_Sz_IGkazfobhvTpV3Y8Ag.png"><figcaption></figcaption></figure><p id="b9e0">It’s also possible to tailor the appearance of the base layer according to your preferences.</p><div id="3dfa"><pre>gsp.pointplot( usa_points, base=usa, basecolor=<span class="hljs-string">"#7aebff"</span>, base_boundary=<span class="hljs-literal">False</span>, title=<span class="hljs-string">"USA Points"</span>, title_kwds={<span class="hljs-string">"fontsize"</span>: <span class="hljs-number">25</span>, <span class="hljs-string">"fontname"</span>: <span class="hljs-string">"sans-serif"</span>, <span class="hljs-string">"fontweight"</span>: <span class="hljs-number">3</span>}, )</pre></div><figure id="ce5a"><img src="https://cdn-images-1.readmedium.com/v2/resize:fit:800/1*AiPv5roDBIrvCc92oIvZ4g.png"><figcaption></figcaption></figure><p id="3d19"><b>Here’s the breakdown of the pointplot function’s parameters:</b></p><p id="a875">• data (GeoDataFrame): The GeoDataFrame used for plotting the map. • base (GeoDataFrame): Base GeoDataFrame on top of which the data will be plotted. Defaults to None. • title (str): Title of the map. Defaults to None. • title_kwds (dict): Keyword arguments for configuring the appearance of the title using matplotlib.pyplot.title. Defaults to an empty dictionary. • figsize (tuple): Size of the figure. Defaults to (15, 15). • color (str): Color of the point. Defaults to “#ffb536”. • edgecolor (str): Color of the map’s edges. Defaults to “black”. • basecolor (str): Color of the base data. Defaults to “#F1F3F4”. • baseboundarycolor (str): Boundary color of the base data. Defaults to “black”. • base_boundary (bool): Toggle visibility of base data boundaries. Defaults to True. • boundary_linewidth (float): Linewidth of the base data boundaries. Defaults to 0.5. • linewidth (float): Width of lines for shapes. Defaults to 0.5. • annot (bool): If True, annotations are generated. Defaults to False. • annot_column (str/GeoDataFrame column): If annot is True, column should be passed as the source for annotation. Defaults to None. • annot_align (str): Text alignment for annotations. Defaults to “center”. • annot_kwds (dict): Keyword arguments for annotation customization. Defaults to an empty dictionary. • ax (matplotlib axis): Existing axis for plotting. Defaults to None. • axis_on (bool): Toggle axis visibility. Defaults to False. • facecolor (str): Figure’s face color. Defaults to “white”. • **geopandas_plot_kwds: Additional Geopandas plot keyword arguments.</p><p id="fd44">Returns: Matplotlib axis object (ax).</p><h1 id="44de">Tips for Polished Maps</h1><p id="46bb"><b>Harmonious Color Choices:</b> Experiment with color palettes to create maps that are visually pleasing and easy to understand. Choose colors that enhance the readability of your map.</p><p id="6be4"><b>Precise Annotations:</b> Annotations provide context to your maps. Customize annotation alignment and appearance to guide viewers through your spatial narrative seamlessly.</p><p id="b235"><b>Seamless Matplotlib Integration:</b> Leverage the integration with Matplotlib to fine-tune your maps’ aesthetics, titles, and labels for a polished final product.</p><h1 id="071e">Conclusion</h1><p id="3df6">In this tutorial, we’ve covered the essentials of crafting geospatial maps using the gspatial_plot library. With gspatial_plot, the process of geospatial mapping becomes more manageable and easy. See you in the next tutorial— happy mapping!</p></article></body>

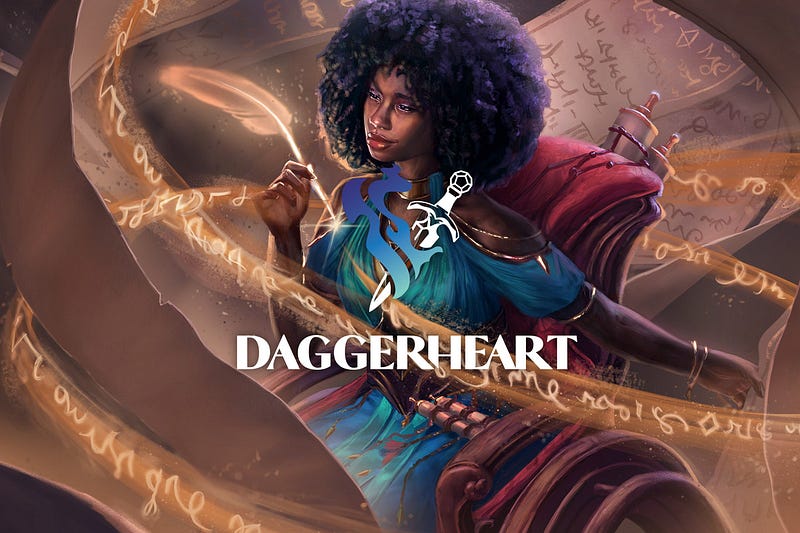
Daggerheart: Strange Games for Boards Are All That TTRPGs Are

Delving into RPG’s Enigmatic Realms

Image by author

In the dimly lit room of an old tavern, a group of adventurers gathers around a weathered table. The scent of ale and candle wax fills the air as they prepare to embark on a journey unlike any other.

Their weapons are not steel or magic, but pencils, dice, and character sheets.

Welcome to the world of tabletop role-playing games (TTRPGs), where imagination knows no bounds and the only limit is the extent of one’s creativity.

Among these games, one name stands out Daggerheart. A game shrouded in mystery and intrigue, Daggerheart beckons players to delve into its enigmatic realms, where every roll of the dice holds the promise of adventure and peril.

The Call to Adventure:

For the uninitiated, TTRPGs may seem like nothing more than strange games played on boards.

But for those who dare to venture into their realms, they discover a world of endless possibilities.

As the dungeon master unfolds the story, players find themselves drawn into a narrative where they are the heroes, shaping the course of events through their actions and decisions.

Creating Characters, Crafting Stories:

In Daggerheart, players are not merely spectators in a pre-written tale, but active participants in the creation of their own destinies.

Through the process of character creation, they breathe life into their avatars, imbuing them with quirks, strengths, and flaws.

Each character becomes a reflection of its player, a vessel through which they explore the complexities of identity and agency.

Navigating the Realm of Imagination:

As the game unfolds, players find themselves navigating a realm where the boundaries of reality blur and the power of imagination reigns supreme.

In Daggerheart, the line between truth and fiction is often indiscernible, as players grapple with moral dilemmas, unravel ancient mysteries, and confront the shadows lurking in the darkness.

The Thrill of Discovery:

As the adventurers delve deeper into the heart of Daggerheart, they uncover secrets long forgotten and treasures hidden in the depths of the earth.

With each new discovery comes a thrill unlike any other, as players revel in the sense of accomplishment that comes from overcoming obstacles and outsmarting adversaries.

The Bonds of Fellowship:

Yet, amidst the dangers and challenges of their quest, the adventurers find solace in the bonds of fellowship forged around the table.

In Daggerheart, friendship is more than just a word it is a lifeline, a source of strength and support in times of need.

Through laughter and tears, triumphs and defeats, they stand together as comrades-in-arms, united by a shared sense of purpose and adventure.

Conclusion:

As the session draws to a close and the players bid farewell to the world of Daggerheart, they carry with them memories that will last a lifetime.

For in the realm of TTRPGs, strange games for boards are not just a pastime, but a journey of self-discovery, camaraderie, and endless adventure.

And though they may return to the mundane world outside, a part of them will always remain within the enigmatic realms of Daggerheart, ready to embark on new quests and forge new legends.

If my stories brighten your day, subscribing is the next step.💙💎📧

This content thrives on the backing of amazing readers like you. If you enjoyed it, please share it and subscribe to get all upcoming stories sent right to your inbox.

If you’re feeling extra generous and want to support my writing, consider becoming a Medium member! For just $5 a month

Next To Read ..

Thanks for being amazing!

If you enjoyed this article, you can help me share this knowledge with others by:👏claps, 💬comment, and be sure to 👤+ follow.

Illumination Gaming
Life
Life Lessons
Self Improvement
Games
Recommended from ReadMedium