
Courage to Learn ML: A Deeper Dive into F1, Recall, Precision, and ROC Curves
F1 Score: Your Key Metric for Imbalanced Data — But Do You Really Know Why?

Welcome back to our journey with the ‘Courage to Learn ML’ series. In this session, we’re exploring the nuanced world of metrics. Many resources introduce these metrics or delve into their mathematical aspects, yet the logic behind these ‘simple’ maths can sometimes remain opaque. For those new to this topic, I recommend checking out Shervin’s thorough post along with the comprehensive guide from neptune.ai.
In typical data science interview preparations, when addressing how to handle imbalanced data, the go-to metric is often the F1 score, known as the harmonic mean of recall and precision. However, the rationale behind why the F1 score is particularly suitable for such cases is frequently left unexplained. This post is dedicated to unraveling these reasons, helping you understand the choice of specific metrics in various scenarios.
As usual, this post will outline all the questions we’re tackling. If you’ve been pondering these same queries, you’re in the right place:
- What exactly are precision and recall, and how can we intuitively understand them?
- Why are precision and recall important, and why do they often seem to conflict with each other? Is it possible to achieve high levels of both?
- What’s the F1 score, and why do we calculate it as the harmonic mean of recall and precision?
- Why is the F1 score frequently used for imbalanced data? Is it only useful in these scenarios?
- How does the interpretation of the F1 score change when the positive class is the majority?
- What’s the difference between PR and ROC curves, and when should we prefer using one over the other?
With a fundamental understanding of these metrics, our learner approaches the mentor, who is busy doing laundry, with the first question:
I’m working on a game recommendation system. It’s designed to suggest video games based on users’ preferences and lifestyles. But I’ve noticed that it mostly recommends popular games, like this year’s TGA game — Baldur’s Gate, and users are missing out on niche and cult classic games they’re searching for. How can I tackle this issue? Should I change my algorithm or maybe use LLM, given its power?

Let’s not rush to the conclusion that you need the most advanced algorithm just yet. Instead, let’s explore why your model isn’t performing as expected. It seems your model scores well in Precision@k but get a low Recall@k.
To understand this better, let’s break down these metrics:
- Percision@k = (# of top k recommendations that are relevant)/(# of items that are recommended). In simple terms, it measures how many of the games your model recommends are actually relevant to the users.
- Recall@k = (# of top k recommendations that are relevant)/(# of all relevant items). This tells us how many of the relevant games actually make it to your top k recommendations.
From this, it seems users often find relevant games in your recommendations, but not all relevant games are making it to your top k list. It’s important to note that the items recommended are those your model predicts to be relevant, which can be considered as ‘the number of items predicted to be relevant’.
Hold on, are you suggesting I should use both recall and precision to evaluate my model? But aren’t recall and precision mainly used for imbalanced data, similar to their harmonic mean, the F1 score?
You’ve grasped an essential aspect of precision and recall, and you understand why accuracy isn’t always reliable. However, your perspective on recall and precision seems a bit limited, and you shouldn’t restrict them to just one scenario, handling imbalanced data. Let’s dissect this into smaller parts, starting with:
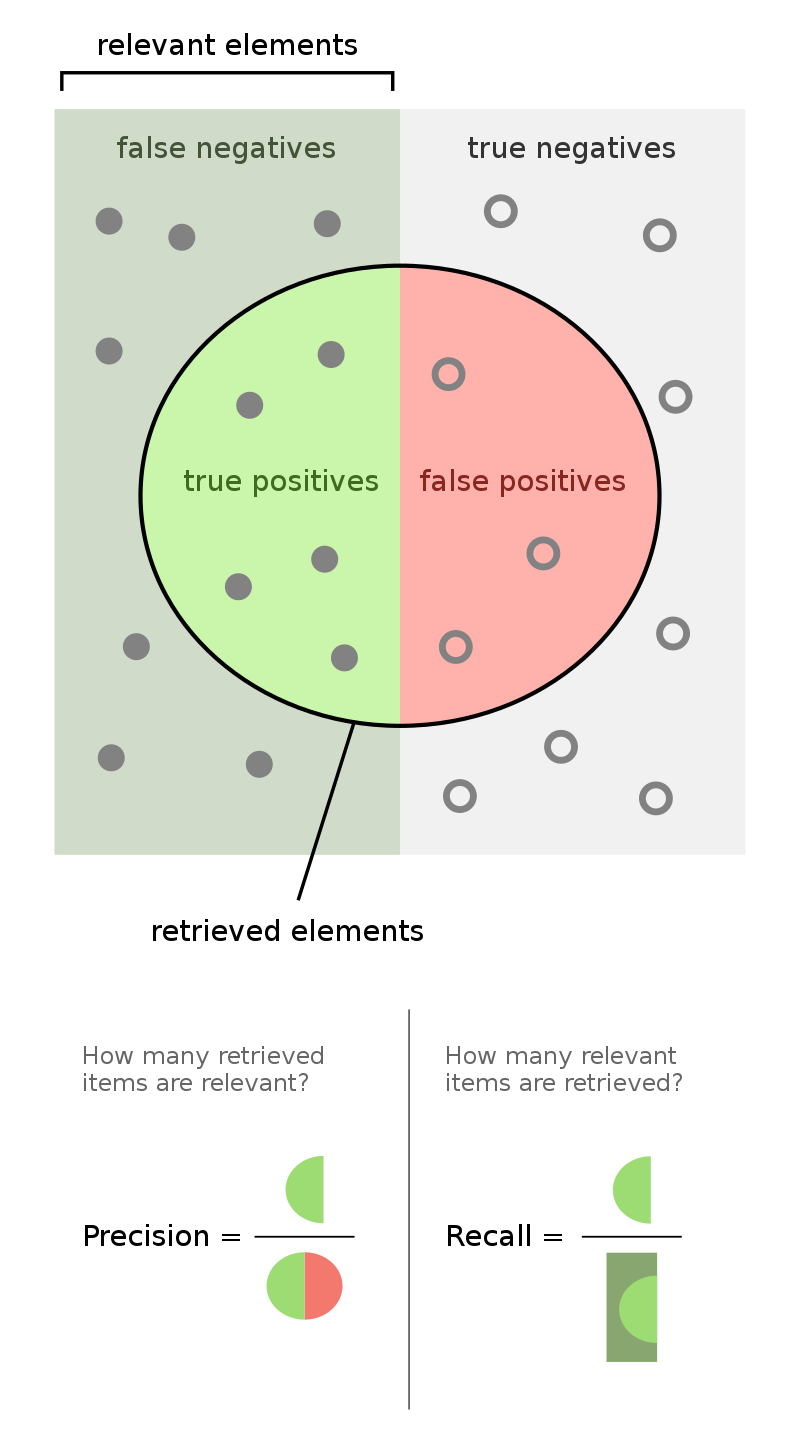
What are precision and recall?
Precision measures the accuracy of the model’s positive predictions, calculated as
Precision = # of samples correctly predicted as positive / total # of samples predicted as positive = true positive / (true positive + false positive)
On the other hand, recall assesses how well the model identifies all positive cases, calculated as
recall = # of samples correctly predicted as positive / total # of actual positive samples = true positive / (true positive + false negative)
A quick tip for remembering TP, TN: The first letter (True/False) indicates if your prediction is correct or not, while the second (Positive/Negative) refers to the predicted label. So, true positive means ‘correctly predicted as positive,’ and false negative is ‘incorrectly predicted as negative…it’s actually positive!’
The total number of predicted positives is the sum of true positives (TP) and false positives (FP).

Let me offer an intuitive example to understand those two terms: Consider I’m sorting laundry, my aim is to select all the dirty clothes from the pile for washing. In this scenario, precision is about how accurately I can identify a piece of clothing as dirty. Meanwhile, recall measures how many of the actual dirty clothes I can correctly identify
Then, our next question is:
Why do we care about precision and recall, and why do they often seem to conflict? Is it possible to have both high precision and recall?
The importance of precision and recall lies in their complementary nature. Let’s use the laundry sorting analogy again. My objectives are twofold: first, to ensure all dirty clothes are picked up, and second, to avoid unnecessary washing. Linking this back to metrics, precision is like my aim to correctly identify dirty clothes and save effort by not washing clean ones. Recall, meanwhile, assesses how well I manage to gather all the dirty clothes.
To clarify, let’s look at two extreme scenarios:
- With a focus solely on high precision, I’d be extremely selective, only choosing visibly stained clothes for the wash. This means potentially overlooking less obvious dirt, like a shirt with only a bit of cat hair. Consequently, I’d end up washing only a small portion of the laundry, leaving behind some dirty items (hence, low recall).
- If I prioritize high recall, I’d wash everything without sorting. This ensures all dirty clothes are cleaned but at the expense of washing clean items too (resulting in low precision).
No matter what kind of laundry types you are, you can see the choice of metrics does impact our (the model’s ) behaviors. Recall and precision measure different aspects and optimizing both simultaneously is challenging. That’s why in classification, we talk about the trade-off between them. They work together to ensure our model accurately predicts while capturing all positive cases.
Next, let’s dive into:
What is the F1 score, and why is it calculated as the harmonic mean of recall and precision?
Most data science interview guides suggest handling imbalanced data by using the F1 score, which is the harmonic mean of recall and precision. But often, they don’t explain why the F1 score is effective in these situations.
Then, why use the F1 score? In model evaluations, we’re concerned with balancing precision and recall — we want correct predictions and comprehensive coverage. Monitoring both metrics separately can be tedious, so a single measure that reflects the balance is preferred. A simple average doesn’t reveal much about the balance; a high score could still mask an imbalance. However, the harmonic mean, used in the F1 score, penalizes extreme values more severely. If either recall or precision is low, it significantly lowers the F1 score.
Consider two hypothetical cases to understand why we use the harmonic mean instead of a simple average:
- Scenario A: Precision = 0.9, Recall = 0.1
- Scenario B: Precision = 0.5, Recall = 0.5 (more balanced case)
Simple average calculation:
- Scenario A: (0.9 + 0.1) / 2 = 0.5
- Scenario B: (0.5 + 0.5) / 2 = 0.5
Harmonic mean calculation (F1 Score):
- Scenario A: 2 * (0.9 * 0.1) / (0.9 + 0.1) = 0.18
- Scenario B: 2 * (0.5 * 0.5) / (0.5 + 0.5) = 0.5
While both scenarios have the same average, the simple average hides Scenario A’s poor recall. The harmonic mean, on the other hand, provides a more accurate reflection of the balance between precision and recall. A higher F1 score indicates a better balance.
Then… why is the F1 Score often used for imbalanced data, and is its use limited to these scenarios?
Let’s explore the challenges of imbalanced data, which is common in binary classification problems. Here, one class often has far fewer samples and represents rare but significant cases (like customer churn or cancer diagnosis). These rare cases usually have higher consequences, and accurately identifying them is crucial. We need a model that not only makes accurate predictions but also effectively identifies these rare cases. This requirement leads us to seek a balance between precision and recall, and the F1 score becomes a handy tool. It provides a single number that reflects this balance, making it a preferred metric in imbalanced datasets. The F1 score’s value lies in its ability to accurately portray a model’s efficacy in spotting the minority class.
However, the F1 score’s usefulness isn’t confined to just imbalanced datasets. It’s also relevant wherever balancing precision and recall is essential, even in balanced datasets. The F1 score remains a vital metric for balancing precision and recall, and it simplifies model comparisons.
Beyond the F1 score, other metrics are also useful for assessing model performance in cases of imbalanced data.
I’ve heard that F1, precision, and recall are asymmetric metrics, meaning they depend on which class is labeled as positive. How does the F1 score’s interpretation change when the positive class is actually the majority?
Good question. To answer that, let’s think about how recall and precision would shift if the majority class is considered positive. Achieving a high recall becomes easier because most samples will be predicted as positive.
But here’s the catch: high precision might be misleading in this scenario. With a larger majority class, it’s easy to get high precision just by predicting the majority class all the time. By switching the majority class to positive, we lose sight of how the model handles the rare class, especially in imbalanced data situations. So, the balance between precision and recall doesn’t guarantee the model’s effectiveness anymore since its focus has shifted. This means a model might show a high F1 score even if it’s not great at identifying the minority class.
When the positive class forms the majority, a high F1 score might not truly reflect the model’s ability to identify the minority class. It could simply mean the model often predicts the majority class.
In such cases, it’s wise to include other metrics less biased towards the majority, like the recall of the negative (minority) class, to get a fuller picture of the model’s performance.
What are the limitations of the F1 score, and what other metrics can we use to evaluate model performance on imbalanced data?
You know, we often approach classification problems in a regression-like manner. What I mean is, some algorithms predict probabilities, not just classes. For these, you need to set a threshold. But the F1 score doesn’t really show how the model performs at different thresholds. That’s where ROC curves or precision-recall curves come in, helping us assess performance across various thresholds.
It’s quite common that we do classification in regression way. What I mean is some algorithm will predict probabilities instead of the class. for those models, we need to choose a threshold. However, F1 score cannot give us an illustration on model performance related to different threshold. So we can use ROC curve or precision and recall curve to consider the model performance with various threshold.
When it comes to imbalanced data, we can use precision-recall curve to observe the model’s performance on balancing precision and recall under different threshold.
To sum it up, for some scenarios, we’d love the model to balance recall and precision well. That’s why we use the F1 score, the harmonic mean of recall and precision, as a single-number metric. But with imbalanced data, where the focus is more on the minority class’s performance, the F1 score becomes particularly valuable since achieving balance is tougher. Other handy tools are ROC and PR (Precision-Recall) curves.
So, for your game recommendation system, consider using multiple metrics. This way, you can better evaluate how well the model retrieves relevant items (recall) and ensures those items are indeed relevant (precision). You could evaluate precision@k and recall@k together, calculate f1@k, or draw PR curves.
In practice, it’s crucial to select model metrics based on the actual cost of errors, like whether recall matters more than precision to you. Using multiple metrics gives a fuller picture of your model’s performance. And remember, the key is to align your metrics with the model’s business or application goals.
Before wrapping up this post, there’s one more topic I’d like to touch on:
What’s the difference between the PR curve and the ROC curve, and when should you choose one over the other?
Most DS interview guides state using the PR curve instead of the ROC curve for imbalanced data, but often don’t explain when to opt for the ROC curve. While I won’t delve into how to draw these curves here (for that, check out the excellent explanation by StatQuest with Josh Starmer here), let’s understand that these curves are drawn by varying the threshold and calculating two metrics (precision and recall for PR, or TPR and FPR for ROC). Both curves represent different balances in binary classification:
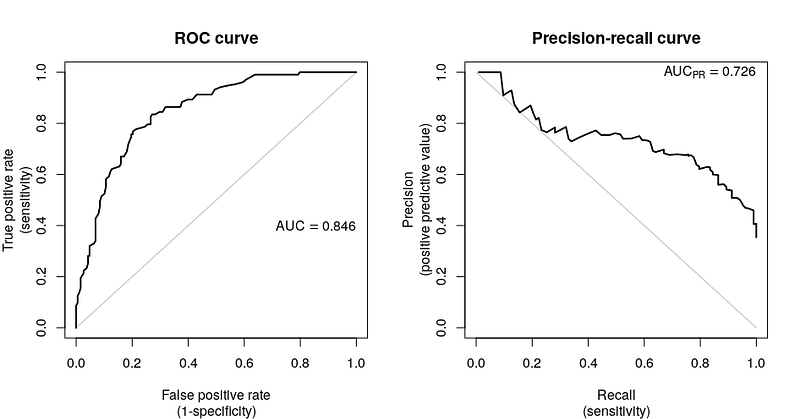
The ROC curve focuses on TPR and FPR; the PR curve on precision and recall:
- TPR (Recall) = # of samples correctly predicted as positive / total actual positive samples.
- FPR = # of samples wrongly classified as positive / total actual negative samples.
While precision and recall focus solely on the model’s performance for the positive class, TPR and FPR provide a broader view of predictability (correct positives vs. misclassified samples).
ROC curves are less sensitive to data distribution, as FPR uses the size of the negative class. If the negative class is the majority, the FPR value can still remain low, even with lots of negative predictions, due to the larger size of this class. This means ROC is less affected by data imbalance. On the other hand, PR curves, with precision calculated using predicted positives, are more sensitive to the positive class.
What does this imply? It means when comparing model performance across different datasets, ROC curves offer more stability than PR curves and can better reflect a model’s performance. So, rather than just remembering PR curves as preferable for imbalanced data, it’s important to recognize that ROC curves provide a consistent measure less influenced by data distribution.
In our upcoming session, the mentor-learner duo will delve into the common loss functions, exploring cross-entropy through the lenses of information theory and MLE. If you’re enjoying this series, remember that your interactions — claps, comments, and follows — do more than just support; they’re the driving force that keeps this series going and inspires my continued sharing.
Other posts in this series:
- Courage to Learn ML: Demystifying L1 & L2 Regularization (part 1)
- Courage to Learn ML: Demystifying L1 & L2 Regularization (part 2)
- Courage to Learn ML: Demystifying L1 & L2 Regularization (part 3)
- Courage to Learn ML: Demystifying L1 & L2 Regularization (part 4)
- Courage to Learn ML: Decoding Likelihood, MLE, and MAP
If you liked the article, you can find me on LinkedIn, and please don’t hesitate to connect or reach out with your questions and suggestions!


