
Custom actuator metrics for better spring boot application monitoring
Use these 3 steps to add custom actuator Prometheus metrics for better spring boot application monitoring

This article describes an elegant way to add a custom actuator Prometheus metric to spring boot applications. Spring boot, a powerful java based framework to develop microservices web applications provides many easy-to-configure solutions for developer's needs.
Developing a microservices application is complete only when we can monitor these microservices. Spring boot provides Actuator to help monitor these microservices. Actuator uses HTTP endpoints to provide information about the application. The actuator provides many metrics like database connections, thread information, memory information, HTTP client and server requests, etc. Below are the 3 steps to add custom actuator Prometheus metrics in the spring boot
- Enable actuator in spring boot application
- Add Prometheus micrometer to the application
- Add custom metrics to micrometer Prometheus
1. Enable Actuator in Spring Boot Application
To add an actuator to the spring boot application add the following to pom.xml
<dependency>
 <groupId>org.springframework.boot</groupId>
 <artifactId>spring-boot-starter-actuator</artifactId>
</dependency>
Run your spring application using
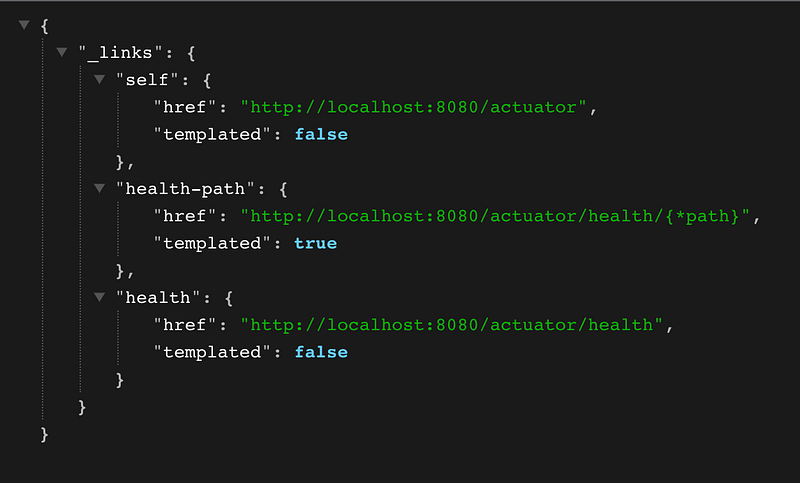
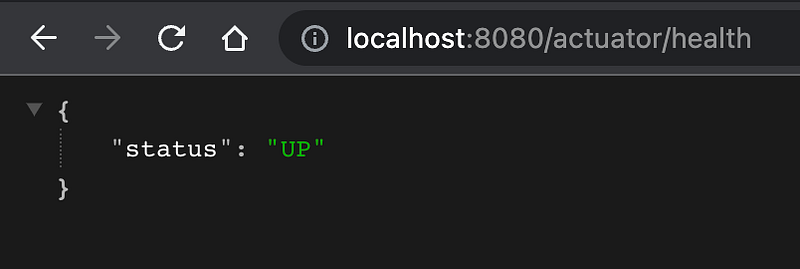
mvn spring-boot:runThe application will run on port 8080 by default. Go to http://localhost:8080/actuator to view the actuator endpoints like below.
The actuator provides a health check endpoint that shows the status of the application. The status is “UP” if the application is healthy and “DOWN” if there are any issues
The actuator does provide more than just health information. To unlock its true potential expose its endpoint to the outside world. To do this, include the following in application.properties
management.endpoint.info.enabled=true
management.endpoints.web.exposure.include=*
Now go to http://localhost:8080/actuator to see more actuator endpoints exposed like below
{"_links":{"self":{"href":"http://localhost:8080/actuator","templated":false},
"beans":{"href":"http://localhost:8080/actuator/beans","templated":false},
"caches-cache":{"href":"http://localhost:8080/actuator/caches/{cache}","templated":true},
"caches":{"href":"http://localhost:8080/actuator/caches","templated":false},
"health-path":{"href":"http://localhost:8080/actuator/health/{*path}","templated":true},
"health":{"href":"http://localhost:8080/actuator/health","templated":false},
"info":{"href":"http://localhost:8080/actuator/info","templated":false},
"conditions":{"href":"http://localhost:8080/actuator/conditions","templated":false},
"configprops":{"href":"http://localhost:8080/actuator/configprops","templated":false},
"configprops-prefix":{"href":"http://localhost:8080/actuator/configprops/{prefix}","templated":true},
"env":{"href":"http://localhost:8080/actuator/env","templated":false},
"env-toMatch":{"href":"http://localhost:8080/actuator/env/{toMatch}","templated":true},
"loggers":{"href":"http://localhost:8080/actuator/loggers","templated":false},
"loggers-name":{"href":"http://localhost:8080/actuator/loggers/{name}","templated":true},
"heapdump":{"href":"http://localhost:8080/actuator/heapdump","templated":false},
"threaddump":{"href":"http://localhost:8080/actuator/threaddump","templated":false},
"metrics":{"href":"http://localhost:8080/actuator/metrics","templated":false},
"metrics-requiredMetricName":{"href":"http://localhost:8080/actuator/metrics/{requiredMetricName}","templated":true},
"scheduledtasks":{"href":"http://localhost:8080/actuator/scheduledtasks","templated":false},
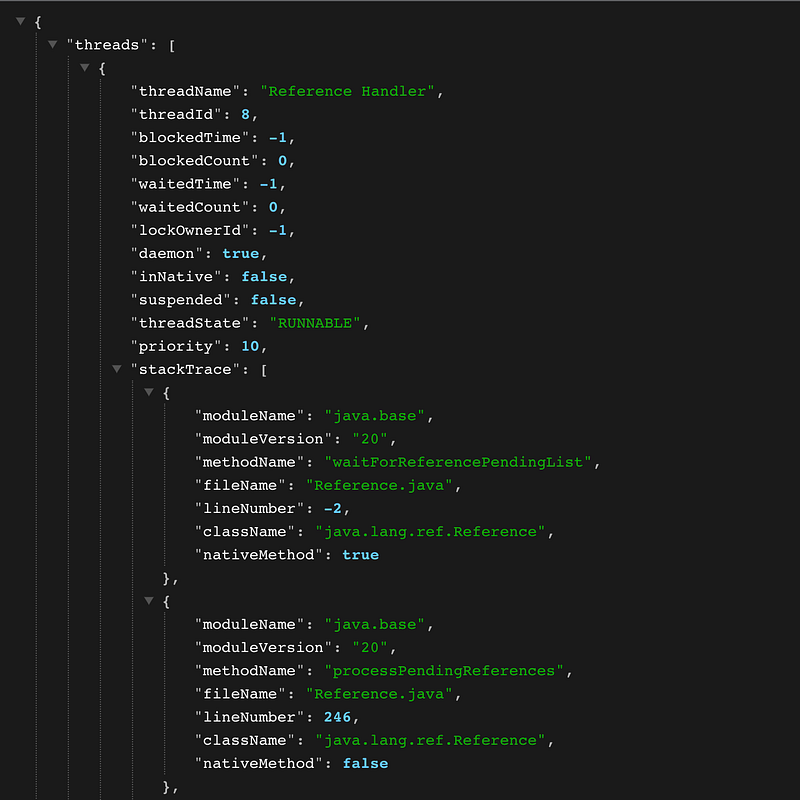
"mappings":{"href":"http://localhost:8080/actuator/mappings","templated":false}}}As seen above the actuator provides information about beans, env, heap dump, thread dump, metrics, etc. To get any detailed information click on the http link. In the case of a thread dump click: http://localhost:8080/actuator/threaddump
2. Add Micrometer Prometheus-based metric to the application
Next to publish the metrics to monitoring tools like Prometheus, Datadog, or Dynatrace a standard format is required. Micrometer acts as that intermediate layer to easily interface with the monitoring tools. Prometheus is chosen for this example which performs time series analysis and uses a pull-based approach. Simply add a micrometer Prometheus setup to the application by including the below dependency
<dependency>
<groupId>io.micrometer</groupId>
<artifactId>micrometer-registry-prometheus</artifactId>
<scope>runtime</scope>
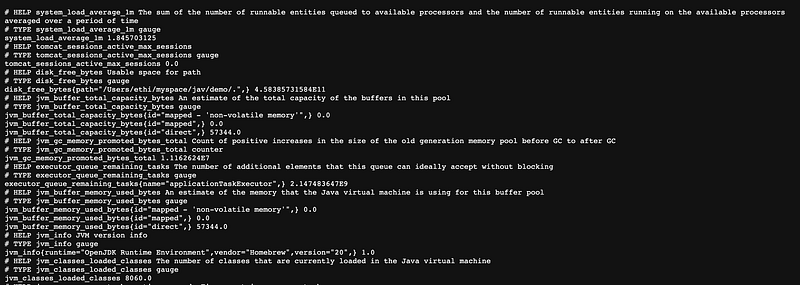
</dependency>Now rerun the application to see the new actuator point — http://localhost:8080/actuator/prometheus.
3. Add custom metrics to micrometer Prometheus
Now that the default Prometheus metrics are available time to add the custom metrics. Custom metrics can be added in service or business logic classes. Two objects are essential to building the custom metric
- MeterRegistry
- Metric Type Object — Counter/Gauge/Timer
- Use Spring boot @Autowired annotation to create MeterRegistry
    @Autowired
MeterRegistry registry;- Next, initialize the metric type in the constructor or post-construct methods like below
@PostConstruct
public void initialize(){
 counter = Counter.builder("custom_counter_metric").register(registry);
 Gauge.builder("custom_gauge_metric",numbersList,Collection::size).register(registry);
 timer = Timer.builder("custom_timer_metric").register(registry);
}- Record the metrics in methods as follows
# Counter
//custom logic
counter.increment();
counter.increment(5);
# Timer
//custom logic
timer.record(Duration.between(tenMinuteBefore,LocalDateTime.now()).getSeconds(), TimeUnit.SECONDS);A sample service class is as follows
@Service
public class DemoService {

    @Autowired
    MeterRegistry registry;

    private Counter counter;

    private ArrayList numbersList = new ArrayList<>();

    private Timer timer;


    @PostConstruct
    public void initialize(){
       counter = Counter.builder("custom_counter_metric").register(registry);
       Gauge.builder("custom_gauge_metric",numbersList,Collection::size).register(registry);
       timer = Timer.builder("custom_timer_metric").register(registry);
     }

    public void incrementCounter() {
        //custom logic
        counter.increment();
        counter.increment(5);
    }

    public void processGauge() {
        numbersList.add(new Random());
    }

    public void recordTime() {
        LocalDateTime tenMinuteBefore = LocalDateTime.now().minusMinutes(10);
        //custom logic
        timer.record(Duration.between(tenMinuteBefore,LocalDateTime.now()).getSeconds(), TimeUnit.SECONDS);
    }
}
Once these methods are called navigate to http://localhost:8080/actuator/prometheus/ to see the custom metrics
# HELP custom_counter_metric_total
# TYPE custom_counter_metric_total counter
custom_counter_metric_total 6.0
# HELP custom_gauge_metric
# TYPE custom_gauge_metric gauge
custom_gauge_metric 1.0# HELP custom_timer_metric_seconds_max
# TYPE custom_timer_metric_seconds_max gauge
custom_timer_metric_seconds_max 0.0
# HELP custom_timer_metric_seconds
# TYPE custom_timer_metric_seconds summary
custom_timer_metric_seconds_count 1.0
custom_timer_metric_seconds_sum 600.0Thus custom metrics are added to the spring boot application. Happy Monitoring !!!
Originally published at https://ethigeek.com.
Thank you for your comments and for sharing my stories to reach a broader audience.
If you like my article and would like to support me, make sure to: