
Create Your Python’s Custom Prometheus Exporter
Build and design your custom metrics exporter

Despite all the exporters (https://prometheus.io/docs/instrumenting/exporters/) that Prometheus and its community can offer, in some particular use cases, you may want to design your own exporter to run your custom checks. No worries, Prometheus has got you covered!
If you check this GitHub repository, you will find a Python Prometheus client that you can use and abuse to build up your exporter.
Through this article, we will build a simple exporter to monitor the number of .txt files inside a folder and return a custom metric over the classic /metrics endpoint.
Before we discuss the code, let’s quickly look at how Prometheus works and how you can expose your metrics to have them scrapped by the tool.
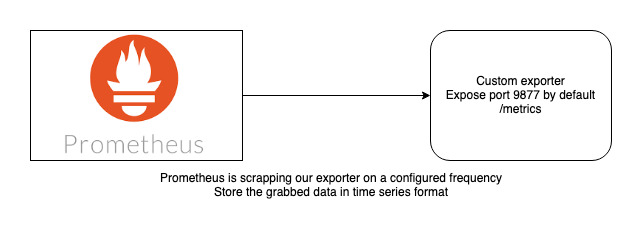
Nothing complicated here. We will expose an endpoint that is accessible by another instance.
I also highly suggest reading this documentation that can help to create a proper naming convention for our metrics. Note that this is just a convention, meaning you can create metrics with the name you want.
Speaking about the code itself, I will use very few modules to keep it simple:
- logging module to add some logs to our exporter
argparse, to pass our folder/extension argumentsos,time(no description is needed for these two)prometheus_client, specifically two methods:start_http_server(start up our endpoint) andGauge.
A gauge is a metric that represents a single numerical value that can arbitrarily go up and down.
This code creates a super simple class that we will use a dictionary (metric_dict) to store our metrics. You can store as many metrics as you want in a dict.
I’m using a dictionary here because the main program is an infinite loop. I want to keep the same metric and just update the Gauge counter by the current value.
The class contains two arguments, the folder to watch and the file extension to count.
The custom function (
count_file_in_folder) is in charge of counting our metric value
That function is pretty straightforward; we just create a list of matching files in a folder and return its length. We use list comprehension here to make it a little bit more pythonic.
The exporter metric part is really easy to go through.
1) We create a new Gauge into our dict if the metric does not exists (basically, first run of the loop)
def create_gauge_for_metric(self, metric_name):if self.metric_dict.get(metric_name) is None:self.metric_dict[metric_name] = Gauge(metric_name, f"number of *{self.ext} files in {self.folder}")2) We set a value for our Gauge based on the count_file_in_folder result.
The main program is an infinite loop on top of a web server
The main function uses the start_http_server method from the Prometheus client, which takes a port as an argument to start.
The while True loop is running our two metrics functions (create_gauge_for_metric and set_value). For this example, I put a sleep of ten seconds to refresh more often. This value can be adapted based on your use case.
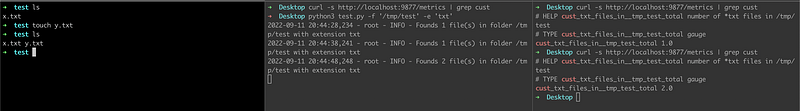
As you can see on the above capture, we have three different terminals opened:
1. On the left, I’m just creating a new file to increment our metric counter
2. The exporter's output log is in the middle of the screen. Note that the number of files increased from 1 to 2.
3. On the right, the metrics endpoint is accessible over port 9877/metrics. The value also increases from 1 to 2.
And, that’s it. As you’ve noticed, creating some metrics and exposing them using the Prometheus client package is really easy.
Nevertheless, I highly encourage you to read the documentation to understand the different metrics types you can use to fit your needs.
In the next article, I will explain how you can have those exporters running into AWS EC2 instances and have the exporter automatically discovered by a Prometheus node running in an EKS cluster located in a different account.
Spoiler, we will use event bridge and lambda.
Let me know if you have any questions regarding this solution!


