
Create a Simple Project Planning App Using Streamlit and Gantt Chart
Learn Streamlit’s Features and Functionalities for File Upload/Download, Editable Tables, Interactive Charts, and More

Introduction
When it comes to project planning and management, Gantt chart is a very popular and helpful visual for project managers and teams to plan and track project roadmap, schedules, and progress. Gantt charts illustrate a project’s tasks, timelines, and other information by listing the tasks to be performed on the vertical axis, and start and finish dates on the horizontal axis.
Instead of creating a Gantt chart from scratch every time using Excel, PowerPoint, or other tools, we can create a simple app using Streamlit to automate the process.
In this article, I will share with you the code and process of creating a simple project planning app using Streamlit. With this app, you can upload your project plan in a CSV file (following the template provided in the app), edit the project plan within the app, and instantly generate a beautiful, interactive Gantt chart.
When you edit your project plan within the app, the Gantt chart will be updated automatically. Once you and your team are done with reviewing and editing the project plan, you can export the interactive Gantt chart to HTML or PNG and share it with others.
I had a lot of fun building this app and also found some cool features and tricks about Streamlit that I wish I knew earlier! So without further delay, let’s begin creating the app! Here is a short YouTube video to demo the app:
Pre-requisite
If you haven’t already done so, you need to install streamlit, streamlit-aggrid, and plotly on your computer to create this app.
#1: Installation of Streamlit:
You can refer to the following article and follow the instructions to install Streamlit and learn the basics.
#2: Installation of streamlit-aggrid:
Streamlit-aggrid is a custom Streamlit component that is built on top of AG Grid (Agnostic Grid ). You can use streamlit-aggrid to display pandas dataframes as interactive, editable tables in Streamlit. You can edit, sort, filter the tables just like how you do it in Excel which is very cool.
pip install streamlit-aggrid#3: Installation of Plotly:
Plotly is an interactive, open-source graphing library that covers a wide range of chart types and data visualization use cases. It has a wrapper called plotly.express which is a higher-level interface to Plotly. We will use plotly.express to create a Gantt chart in the app.
pip install plotlyOverview of the App’s UI and Main Features
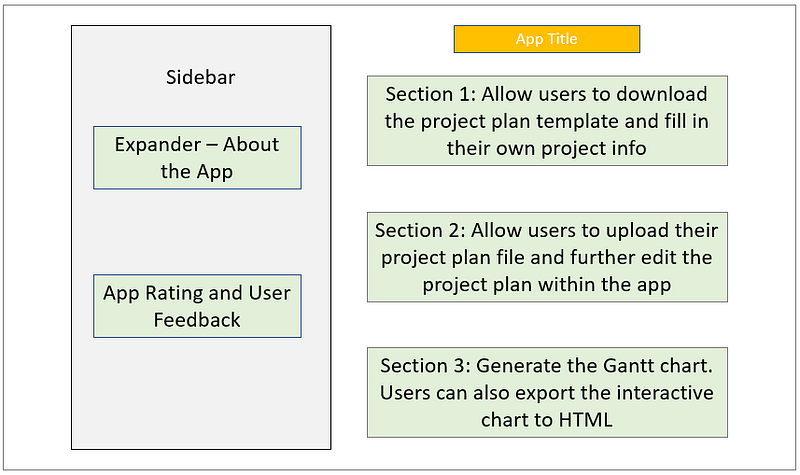
Before we start coding, let’s take a look at the overall design and main features of the app. The app is made up of four sections:
- Sidebar: Display the information about the app and collect user feedback.
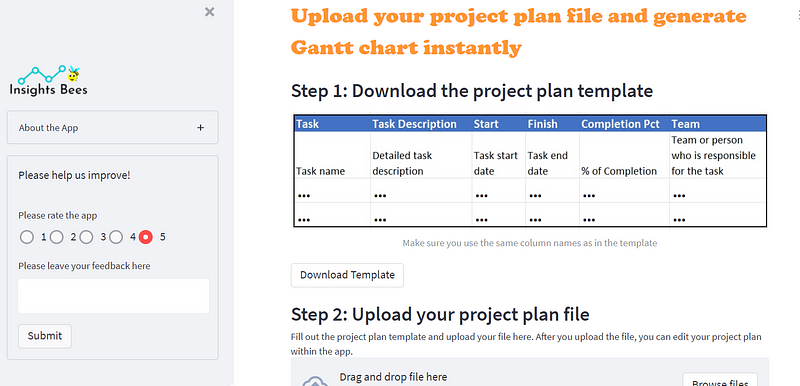
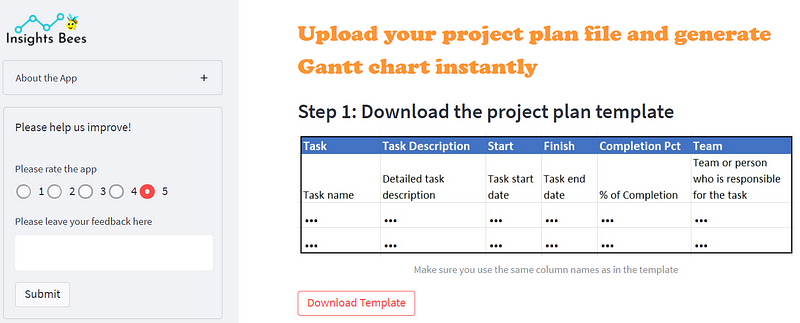
- Section 1: Allow users to download the project plan template.
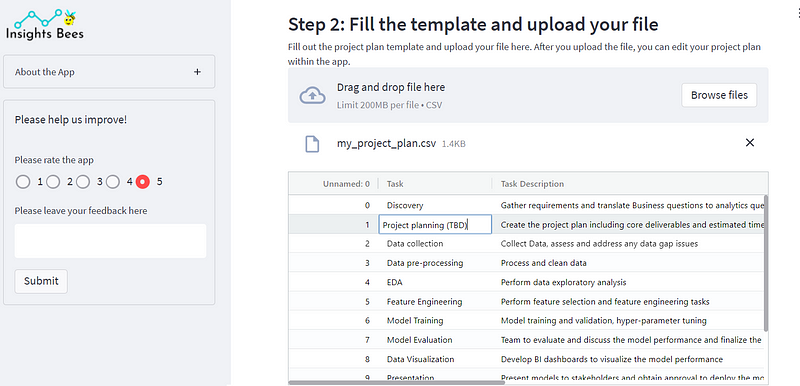
- Section 2: Allow users to upload their project plan file and display an editable table with which users can interact.
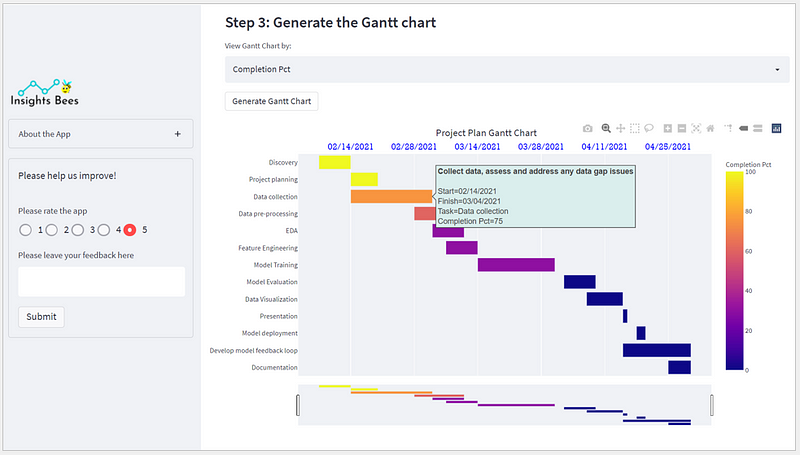
- Section 3: Users click a button to generate an interactive Gantt chart with color-coding by team or project progress. Users can also export the chart to PNG or HTML and share it with others.
Launch Streamlit and Import Libraries
Let’s open the VS code editor (or any text editor of your choice), create a new empty python file, and save it as project_management_app.py in your project folder. Then we fire up Streamlit from the Anaconda terminal window. A blank Streamlit app should appear in your local web browser.
streamlit run project_management_app.py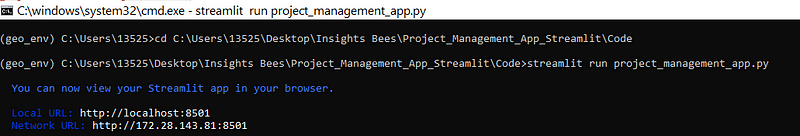
Let’s also import all the necessary libraries needed for building this app:
Create the Sidebar
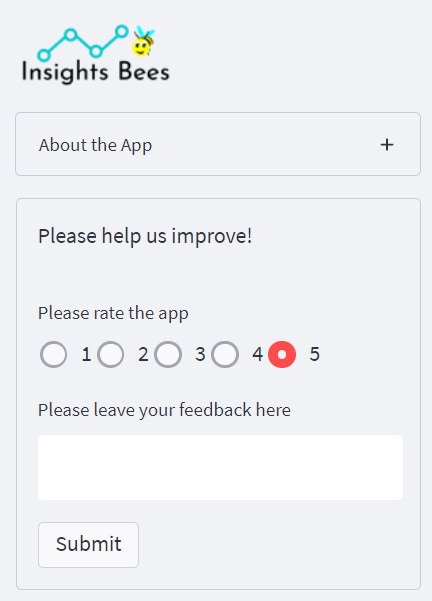
In the sidebar, we’ll display an optional brand logo, an expander to provide some information about the app, and a user feedback section. Pay close attention to lines 16 and 17 — by using CSS we are able to display the radio buttons horizontally (as opposed to the widget’s default vertical direction).
Also notice that in lines 14–25 we use st.form_submit_button() and st.form() to batch input the widgets together and submit the widget values with the click of a button, which will only trigger a single rerun of the entire app!
Create the Main Interface — Section 1
Now we are ready to move on to the main interface of the app. We want the users to be able to download the project plan template from our app so that they can fill out the information and upload it to the app in the next step.
Line 2–5: We add a title to the app. We use CSS and st.markdown() to style the text and make it more visually appealing.
Line 13–23: We import the project template (a CSV file we created) into a pandas dataframe. Then we use st.download_button() to allow users to download the pandas dataframe as a CSV file. We specify the label of the download button in line 19 and give a name to the file that is to be downloaded to the user’s computer in line 21.
Create the Main Interface — Section 2
After users fill out the template with their own project plan details, they can upload their file to the app in order to generate a Gantt chart. We import their uploaded file to a pandas dataframe. However, if we just use st.write(df) to display the dataframe in Streamlit, it will just be a static table, and users can not edit or interact with it.
Let’s say you uploaded your draft plan to the app and want to review the plan with your team before generating a final version of the Gantt chart. It would be nice if you can edit the project plan within the app and have the Gantt chart refreshed automatically. How do we achieve that?
In order to make the table displayed in the app editable, we need to use st_aggrid(), a custom Streamlit component that is built on top of AG Grid (Agnostic Grid ). This component displays an interactive table from a pandas dataframe in which you can edit, sort, filter, etc., just like what you do in Excel. Deleting or Inserting rows is challenging to do with st_aggrid(). There are some workarounds to achieve the functionality, but for simplicity purposes, we’ll leave this feature out of the app.
Another important thing to notice is that after we create a file uploader (line 4) using st.file_uploader(), we need to put the rest of the code (line 6–18) within the if uploaded_file is not None: statement. Using this statement ensures that when a CSV file hasn’t been uploaded, the app doesn’t throw any error message for not finding any files to import and display.
Create the Main Interface — Section 3
In this last section, we want to generate a Gantt chart based on the project plan file that users uploaded in the previous step. We will use plotly.express to create the chart, use st.button() to generate and display the Gantt chart, and use fig.write_html() to export the chart to HTML.
In the code below, lines 19–71 are used for creating the main interface — section 3. Notice that the code also needs to be placed within the if uploaded_file is not None: statement.
Notice that in line 22, we created a select box to allow users to either view the Gantt chart tasks by team or by task completion. We pass this user input to the color parameter in line 29. Line 30 allows users to view the detailed description of a task by hovering over the bars in the chart. Lines 33–56 are just various ways to further fine-tune the chart such as adding a chart title, formatting x and y axes, formatting tick labels, etc. In lines 60–69, we created an export button to allow users to export the Gantt chart to HTML.
There you go! You have successfully created a project planning app using Streamlit!
Final Thoughts
There are certainly more features we can implement in this app to make it more user-friendly. For example, as I mentioned earlier in the article, currently there are no direct or simple ways of using st.aggrid() to enable insertion or deletion of rows in the editable table. There are some workarounds to solve this problem but they seem to be complex and require more research.
Also, it would be helpful for users to export the updated table to a new CSV file or overwrite the old one after they make edits to the table within the app. This functionality should be easy to implement with st.download_button().and similar code snippet shown in section 1.
Lastly, we can also add some input widgets to allow users to customize the Gantt chart, such as increasing and decreasing bar gaps, using a customized chart title, adjusting the height and width of the chart, etc. All of these features can be easily implemented with various Streamlit input widgets (e.g., st.slider(), st.selectbox(), st.text_input(), etc.).
Thanks for reading. I hope you enjoyed the article and learned something new about Streamlit!
You can unlock full access to my writing and the rest of Medium by signing up for Medium membership ($5 per month) through this referral link. By signing up through this link, I will receive a portion of your membership fee at no additional cost to you. Thank you!


