
Have Your Monthly Medium Payments Dropped in Recent Months?
Cracking the Code for Medium’s Current Partner Payment Calculation
How Medium calculates Partner Program payments seems to have changed, again…
Like many others here, I saw my monthly partner program payments slump by as much as 90% from 2019/2020 to early 2021.
Given that Medium had never been a significant source of income for me I wasn’t devastated, but I was unhappy, so I started thinking what could have led to this disheartening decline.
- Could Medium’s reader traffic have dropped off? Unlikely. In fact, it probably continued to grow.
- Could the growth in published content have outstripped the growth in readership? Possible, but hard to tell.
- Could Medium have changed how they calculate their payout per minute of readership? Hmmm…
To make things crystal clear from the get-go — Medium have never told me how they calculate how many cents they pay us for every minute members spend reading our content.
However…
I can look at the data and hypothesize.
Here’s what I found.
What We All Know
From things Medium did tell all of us, they changed the algorithm a while back to calculate partner payments based on member reading time, rather than claps.
That worked great for me, tripling my monthly payments back then.
They also said that not all reading minutes are created equal — if “Sarah” spends twice as long reading Medium content as “Bob,” a minute of Sarah’s read time will be worth less than a minute of Bob’s.
Since we have no way of telling who reads our articles (unless they leave a comment, highlight, or at least clap), and absolutely no way of knowing how many minutes each of them spends across all Medium content, there’s no way to tease out all the specifics of each penny we’re paid.
But…
The Data We Can Access
Each of us can look at our own stats, and then drill down to the stats of any specific article.
There, we can see the number of views (not terribly interesting for our purpose here), earnings, and member read time, both as overall numbers and in histograms.
Even better, if you hover your cursor over a specific date, you’ll see a floating box with the views, earnings, and member read time for that date.
What the Data Show for One Semi-Viral Article
A month ago, I published an article titled “What Retirement Can You Actually Afford with $500k, $1 Million, or $2 Million in Assets?”
In the 30 days following its publication, as you can see in the following screenshot, it garnered 5.2k views and earned $321.57. In the overall stats page, I saw that it garnered 1821 reads.
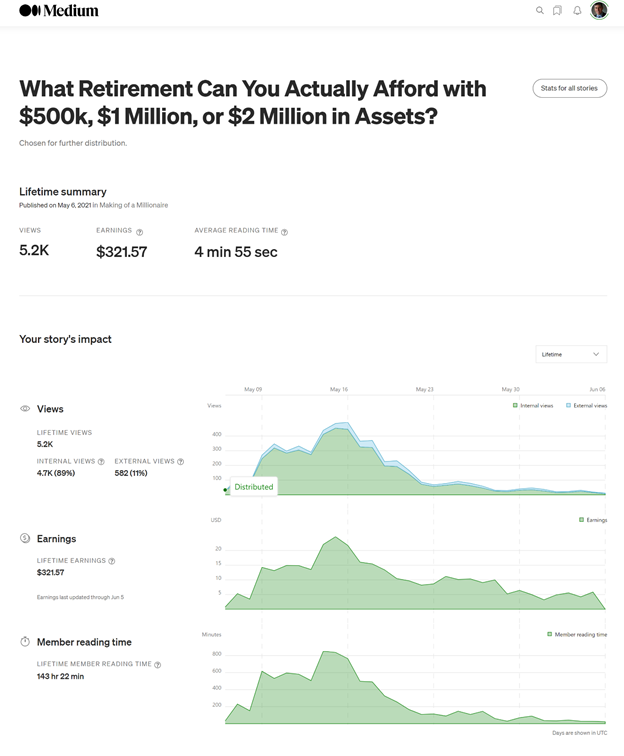
I’m not showing this here to brag, but rather to dive into the plentiful data this article made available over a short period of time.
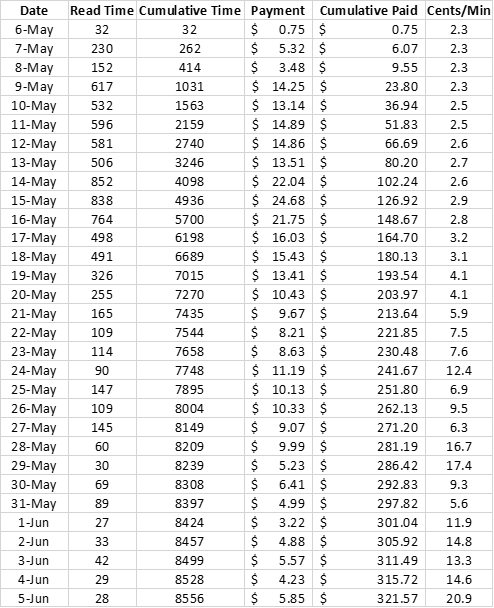
So, what do these data show? The following table shows a day-by-day breakdown.
With these data in hand, I started formulating hypotheses to explain the possible algorithm and testing them.
Hypothesis 1: Payment Per Minute Is Approximately Constant
My first hypothesis was that the payment per minute should be approximately constant.
As you can see in the table, this seems to hold true for the first 4 days. Then the numbers start climbing. And climbing. And climbing even more.
Hypothesis disproven.
Hypothesis 2: Payment Per Minute Is Related to Time Since Publication
This one seems almost plausible, but…
As you can see in the following figure, the values jump up and down too much to make that work.
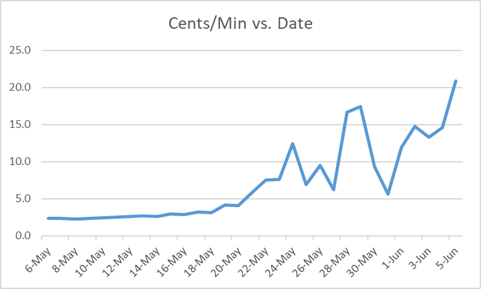
Hypothesis disproven.
Hypothesis 3: Payment Per Minute Is Related to Daily Read Time
This one also doesn’t pan out, as the next figure shows. You can see a wide range of cents/minute values for the lower values of daily read times, all the way from 2.3 cents/minute to over 20 cents/minute.
At the higher daily read times, there’s less fluctuation, but that seems to be due to a different factor as we’ll see below.
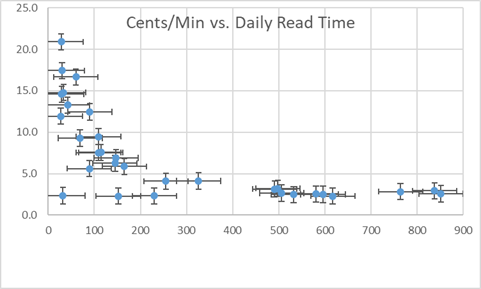
Hypothesis disproven.
Hypothesis 4: Payment Per Minute Is Related to Total Paid Since Publication
This one looks better (I’ve added error bars here so we can see if fluctuations are just statistical in nature.)
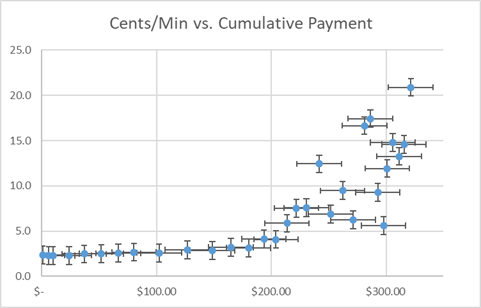
Unfortunately, here too there are too many statistically significant jumps up and down from around $200 and up for this to be right.
Hypothesis not fully accurate.
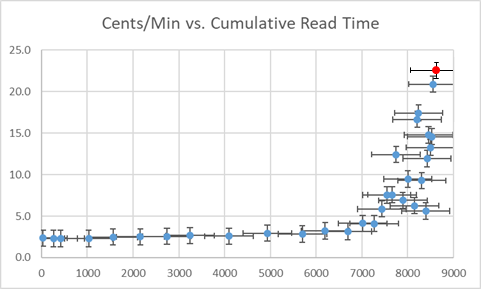
Final Hypothesis: Payment Per Minute Is Related to Total Member Read Time Since Publication
This one seems to fit best.
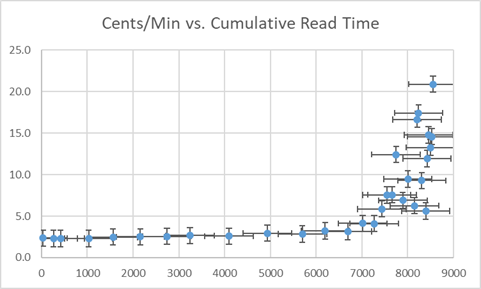
There are still some fluctuations, but these appear to be mostly covered by the error bars.
This looks like a winner!
Can We Fit a Plausible Function to the Data?
Since at the low end the data seem to be nearly constant at 2.3, I decided to start with that as my baseline, and add an exponent.
Using Y = 2.3 + A × exp(B × X), we get the orange fit line with:A = 0.00004
B = 0.0015Where Y is the payment in cents/minute and X is the number of minutes of cumulative member read time.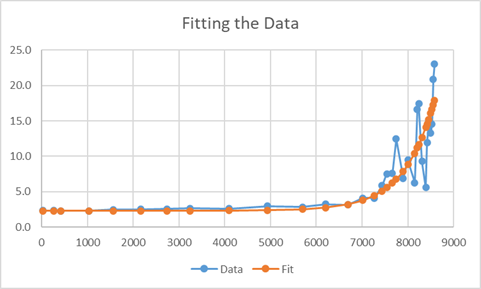
My best guess for how Medium calculates our payment per “typical” minute of read time is thus:
Daily Payment[cents]/Read-Time[minutes] = 2.3 + 0.00004 × exp(0.0015 × cumulative-read-time)However, as you can easily see for points near the right side of the plot, this isn’t a perfect fit.
My tweak to this hypothesis is that the actual daily payment is affected by the average monthly number of minutes spent on Medium by the members who read my article in each specific day.
On days where the number of minutes were high, these fluctuations are small. But on days when there were few readers, if any of them spent less time than average on Medium, that day’s reading would be higher, and vice versa.
Thus, the full formula might be something like this:
Daily Payment[cents]/Read-Time[minutes] = C × [2.3 + 0.00004 × exp(0.0015 × cumulative-read-time)]Where C is the average monthly read time across all Medium members divided by that average across the members who read my article that day.
If C varies between 0.5 and 2.0, it could explain the variations we see in the plot. This is more likely given that the bigger fluctuations show up on days where there were fewer readers (say up to 20 or so), and after the article had been up for 2–3 weeks, so it’s more likely that the readers aren’t those who religiously read most new content.
Testing the Hypothesis
As anyone familiar with the scientific method knows, the true test of a hypothesis isn’t only that it manages to recreate known data. That’s what’s known as a necessary but insufficient condition. The second critical part is to use the hypothesis to make predictions for new data, and then test if the new data agrees with your predictions.
To this end, I carried out two tests.
First, to see if the next day’s payment for this article would match the high ratio of payment per minutes read time. Indeed, yesterday’s payment was $6.23 for 27 minutes of member reading time. This adds a point at 23.1 Cents/Min vs. 8583 cumulative minutes (red marker below). That seems to fit…
Next, I looked at all the other articles I published since the start of May and plotted them on the same graph (green markers below).
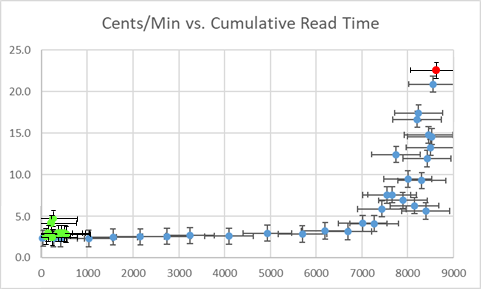
Here, we see two groupings.
One, with 7 data points, matches the original plot extremely well.
The other, with 2 more data points, sits higher than expected, at 4.2 and 4.9 cents/min. This could be explained if the “C” value for those two articles was about 2, matching the tweak mentioned above.
Caveats
Keep in mind that these are just data from a handful of articles, so while it seems to be indicative, it may not tell the full story.
Second, Medium continues to tweak their algorithms, so even if this is accurate (I wouldn’t bet on it being perfectly so), it may change tomorrow or next month.
Speaking to that last, when I went back and looked at the payouts for articles I published in 2019 and 2020, I found that the payout ratio of cents/minute seemed to be between 3 and 5 for both low-impact and high-impact articles.
Those ratios were also consistent over time, with increasing cumulative read time not appearing to affect them, including for the most recent months.
This could be a sign that the above formula is a new development, only applying to articles published recently.
Bottom Line — Lessons Learned
It appears that at some point in late 2020 or early 2021, Medium may have made a big change to how they calculated our partner payments.
Instead of offering more-or-less consistent payments per minute regardless of an article’s impact, they appear to have decided to pay more per minute for high-impact articles at the expense of low-impact ones.
If so, this might explain a 50% or so drop in payment for most articles.
If the number of articles published per month across Medium also increased faster than the number of members reading articles, that might explain the far larger drop (as much as 90%) in our monthly revenues, due to fewer readers arriving at each article.
However…
As seen from the data presented above, we can still get a very nice payout from even a single article, with payout ratios climbing to 20 cents/minute or even higher for high-impact articles.
We can still get a very nice payout from even a single article, with payout ratios climbing to 20 cents/minute or even higher for high-impact articles.
A high-impact article can increase your minutes-read/article 100-fold or more and the payout ratio by another 8-fold, for a total of 800-fold (or more) higher payout/article.
Here’s what this means to me as far as crafting Medium articles:
- Identify a topic with a high level of potential interest from my audience
- Craft a compelling (but not click-baity) heading and subheading
- Insert an attractive and relevant feature image
- Pull my readers into the article by telling a compelling story
- Provide lots of relevant and useful details (the article analyzed above is nominally an 8-minute read, with an actual average read time of 4’55”) with lots of visual aids such as graphs and tables to make it easier to consume the information
If you can get the same fraction of viral or semi-viral articles while publishing daily as you would if you published weekly or twice-weekly, go for it.
I can’t.
That’s why, now more than ever, I’ll take the time to try and hit each of the 5 points above, even at the expense of publishing less frequently.
I’d be very interested to hear from others if their recent experience fits this new paradigm. Please leave a comment sharing your recent results, and whether you think they fit my hypothesis or not.
About the Author
Opher Ganel has set up several successful small businesses, including a consulting practice supporting NASA and government contractors. His most recent venture is a financial strategy service for independent professionals (where you can sign up for his biweekly newsletter and get some nifty free PDFs). You can also connect with him by following his Medium publication, Financial Strategy.
Disclaimer
This article is intended for informational purposes only, and should not be considered financial advice. You should consult a financial professional before making any major financial decisions.