
COVID-19 Growth Modeling and Forecasting with Prophet
Based on all countries COVID-19 data fetched through REST, we model virus growth with logistic function and run forecast with Prophet library in Python

Web UI is available here — https://app.katanaml.io/covid19/
COVID-19 is a hot topic these days. Healthcare workers are the first line of defense. If you are in IT you are part of the fight against the virus. I thought I should do my part and implement a method to forecast coronavirus growth and dates when the number of infections could stabilize. Forecasting new cases growth could be useful in several ways:
- People would be able to understand, at least roughly when all this would end. This helps to keep the spirit and motivation
- Healthcare workers could estimate medical equipment, hospital beds, protective masks, etc.
I was inspired by this post — Modeling Logistic Growth. The author explains how coronavirus growth can be modeled with logistic formula. I thought why not go one step further and implement a forecast for each country using the logistic growth model. Using calculated parameters from the logistic growth model, I’m executing forecast action with the Facebook Prophet library.
I’m fetching COVID-19 daily cases stats from NovelCovid/API REST endpoint. Data fetch is done in covid19_prepare_data.ipynb. Function build_covid19_data() calls REST endpoint, iterates through each country and builds joint Pandas dataframe. This dataframe is persisted into CSV file for further processing.
def build_covid19_data():
    request_str = 'https://corona.lmao.ninja/v2/historical'
    response = requests.get(request_str)
    json_data = response.json() if response and response.status_code == 200 else None

    df = None
    for country in json_data:
        res = build_country_data(country)
        if df is None:
            df = pd.DataFrame(res)
            df.index = pd.DatetimeIndex(df['Report_Date'])
            df = df.drop('Report_Date', 1)
            df = df.sort_values(by=['Report_Date'])
        else:
            df_new = pd.DataFrame(res)
            df_new.index = pd.DatetimeIndex(df_new['Report_Date'])
            df_new = df_new.drop('Report_Date', 1)
            df_new = df_new.sort_values(by=['Report_Date'])
            df = df.merge(df_new, left_index=True, right_index=True)

    df.to_csv('data/covid19_data.csv')
    return df
Function build_country_data(country) does REST response parsing and build an array of data that will be joined into Pandas.
def build_country_data(country):
    res = []
    keys = country.get('timeline').get('cases').keys()
    for key in keys:
        target_entry = {}
        target_entry['Report_Date'] = key
        country_name = country.get('country')
        if country.get('province') != None:
            country_name = country_name + '_' + country.get('province')
        target_entry[country_name + '_cases'] = country.get('timeline').get('cases').get(key)
        target_entry[country_name + '_deaths'] = country.get('timeline').get('deaths').get(key)
        target_entry[country_name + '_recovered'] = country.get('timeline').get('recovered').get(key)
        res.append(target_entry)
    return res
COVID-19 Forecasting
Step 1
We need to identify if the virus in a particular country is still growing exponentially or growth starts to follow a flat curve. Virus spread can be modeled by logistic function (read more here — Modeling Logistic Growth). If a country is in the second part of the function, this means growth is going towards the end, if somewhere in the middle — this means fast growth is still ahead. Logistic function expressed in Python to identify growth:
# Define funcion with the coefficients to estimate
def func_logistic(t, a, b, c):
    return c / (1 + a * np.exp(-b*t))
The core idea — we can identify the day of the fastest growth through logistic function. Based on the fastest growth day data, we can estimate the top number of infections and using this calculate forecast with Prophet. Parameters for logistic function are calculated per each country data using scipy.optimize library.
data = data.reset_index(drop=False)
data.columns = ['Timestep', 'Total Cases']

# Randomly initialize the coefficients
p0 = np.random.exponential(size=3)
# Set min bound 0 on all coefficients, and set different max bounds # for each coefficient
bounds = (0, [100000., 1000., 1000000000.])# Convert pd.Series to np.Array and use Scipy's curve fit to find # the best Nonlinear Least Squares coefficients
x = np.array(data['Timestep']) + 1
y = np.array(data['Total Cases'])(a,b,c),cov = optim.curve_fit(func_logistic, x, y, bounds=bounds, p0=p0, maxfev=1000000)
# The time step at which the growth is fastest
t_fastest = np.log(a) / b
i_fastest = func_logistic(t_fastest, a, b, c)Prophet requires carrying capacity value to be provided to forecast logistic growth. We calculate this value from the identified logistic function. There are two cases.
- When the fastest growth day is still ahead = growth increasing. We add ten days after identified the fastest growth day to calculate the estimated top number of infections. This value will be used by Prophet to do a forecast
- When the fastest growth day is in the past = growth stabilized. We use the current day and add ten days to calculate the estimated top number of infections. This value will be used by Prophet to do a forecast
Check for complete implementation in detect_growth() function from covid19_model.ipynb.
Step 2
Forecast with Prophet is straightforward. We are calculating forecast per country by feeding actual data together with an estimated carrying capacity value. The forecast is calculated for the next 20 days.
df.columns = ['ds', 'y', 'cap']

m = Prophet(growth="logistic")
m.fit(df)
future = m.make_future_dataframe(periods=20)
future['cap'] = df['cap'].iloc[0]forecast = m.predict(future)Let’s see what results we get. I decided to check five countries: Lithuania, Italy, Spain, the USA, and Israel.
Keep in mind this is a forecast, it is based on today's actual numbers, with next day data it can be adjusted. Black dots — actual data, blue line — forecast. Vertical black line — last day available with actual data. Horizontal black line — estimated top number of infections.
Lithuania
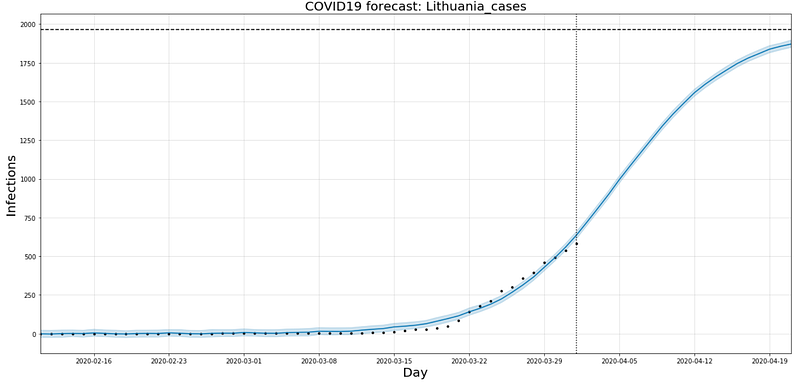
Upper range: ~2000
Expected stabilization period: by 2nd part of April
Italy
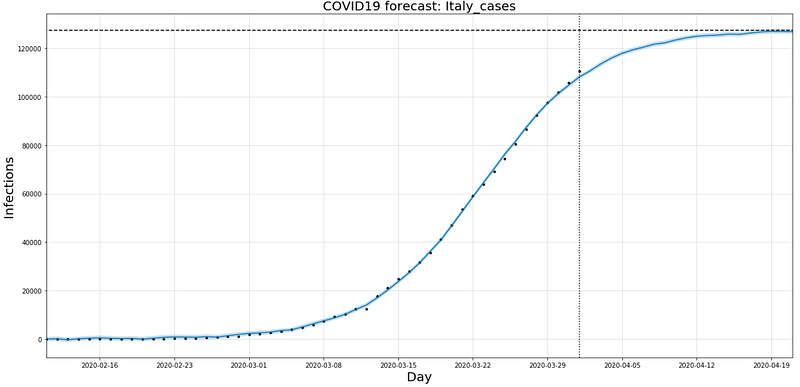
Upper range: ~130000
Expected stabilization period: by 1st part of April
Spain
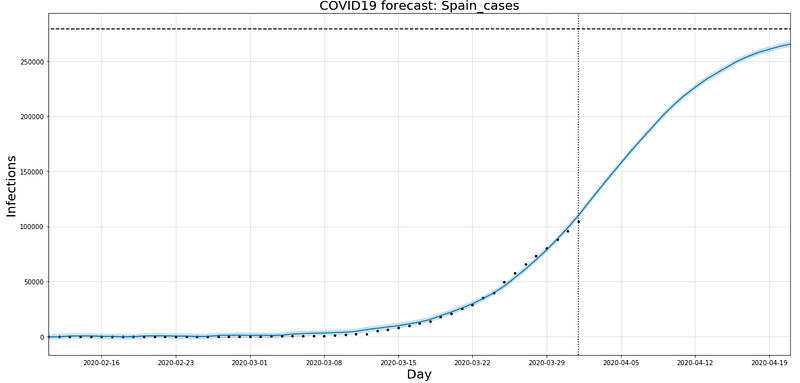
Upper range: ~260000
Expected stabilization period: by 1st part of May
USA
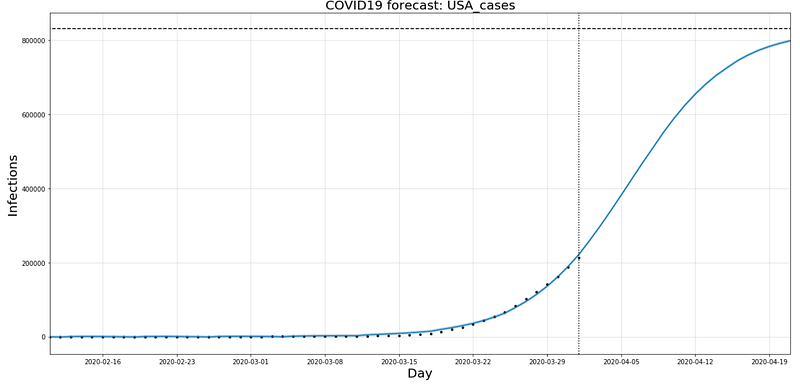
Upper range: ~850000
Expected stabilization period: by 1st part of May
Israel
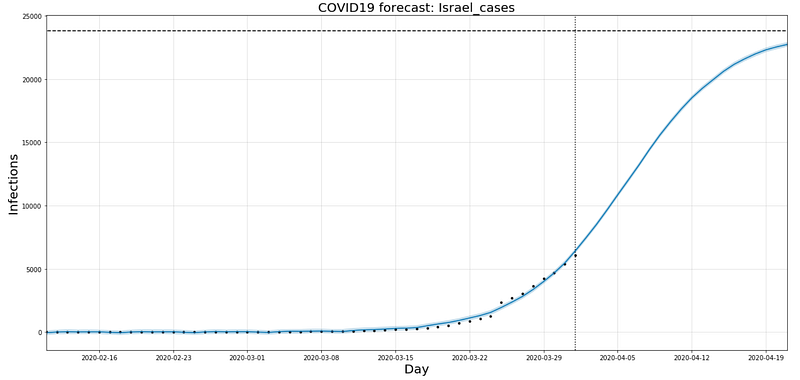
Upper range: ~26000
Expected stabilization period: by 1st part of May
Source code is available on GitHub.
Web UI is available here — https://app.katanaml.io/covid19/
Updates planned for the next version:
- Handle separately cases, when logistic growth model can’t be applied (for example: South Korea, Hong Kong and Singapore)
- Add backtesting indicator


