
Correlation or a Case for Causation?
“But to measure cause and effect, you must ensure that simple correlation, however tempting it may be, is not mistaken for a cause. In the 1990s, the stork population in Germany increased and the German at-home birth rates rose as well. Shall we credit storks for airlifting the babies?”
-Neil deGrasse Tyson, American astrophysicist

Introduction
One of the basic principles of statistics is: correlation is not causation. This means that correlation between two variables does not necessarily mean that one variable causes the other to occur. Correlation and causation are words used a lot in machine learning and predictive analytics. Many people confuse correlation with causation without fully understanding the fundamental concepts behind them.
Correlation between variables shows a pattern in the data and that these variables tend to move or change together. It is common to find reliable correlations for two variables, only to discover that they are not at all causally linked. In some cases, there may be a hidden, underlying variable that causes events that appear to be correlated. We might assume that event A causes event B when in reality, there is another event C that causes both events A and B. For example, researchers have previously found that alcohol consumption is associated with an increased risk for lung cancer. However, smoking was later shown to be a confounding factor. Individuals who consume more alcohol also happen to smoke more, which increases their risk for lung cancer.
In The Book of Why: The New Science of Cause and Effect, authors Judea Pearl and Dana Mackenzie pointed out that machine learning suffers from causal inference challenges. The book stated that deep learning is good at finding patterns in data but is unable to explain the relationships between data elements. Big Data is seen as the silver bullet for all data science problems. However, the authors speculate that “data are profoundly dumb” because it can only know about an occurrence and not why it happened. Alternatively, causal models make up for the disadvantages that deep learning and data mining have. Author Pearl, a Turing Awardee and the developer of Bayesian networks, thinks causal reasoning could help machines develop human-like intelligence by asking counterfactual questions.
What is Correlation?
According to Merriam-Webster dictionary the meaning of correlation is “a relation existing between phenomena or things or between mathematical or statistical variables which tend to vary, be associated, or occur together in a way not expected on the basis of chance alone”.
In Analytics Vidhya website, Chirag Goyal states “correlation is used to find the relationship between two variables which is important in real life because we can predict the value of one variable with the help of other variables, who is being correlated with it”.
Australian Bureau of Statistics says correlation is “a statistical measure (expressed as a number) that describes the size and direction of a relationship between two or more variables”.
Types of Correlations
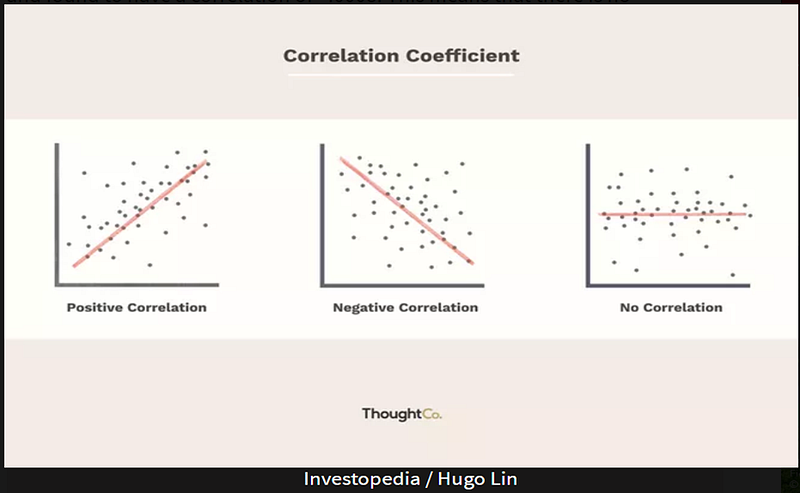
In general, there are three different types of correlations.
- Positive correlation is when you observe variable X increasing then variable Y increases. Similarly, when variable X decreases, then variable Y also decreases.
- Negative correlation is when an increase in variable X leads to a decrease in variable Y or a decrease in variable X leads to an increase in variable Y.
- No correlation is when two variables are completely unrelated and a change in variable X leads to no changes in variable Y.
How to Identify Correlations
One way of identifying correlation is Pearson correlation coefficient (PCC) which is expressed as a value between -1 and 1, where:
- A value greater than 0 indicates a positive association; that is, as the value of one variable increases, then the value of the other variable increases.
- A value of 0 indicates that there is no association between the two variables.
- A value less than 0 indicates a negative association; that is, as the value of one variable increases, the value of the other variable decreases.
Some Examples of Correlations
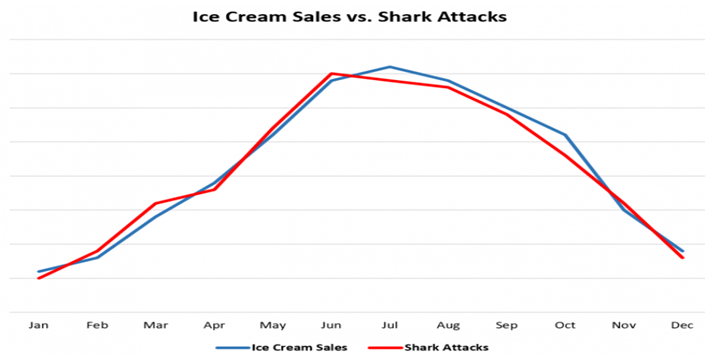
If we collect data for monthly ice cream sales and monthly shark attacks in the United States each year, we will find the two variables are highly correlated. Does this mean that consuming ice cream causes shark attacks? Probably not. The more likely explanation is that more people consume ice cream and get in the ocean when it’s warmer outside, which explains why these two variables are so highly correlated.
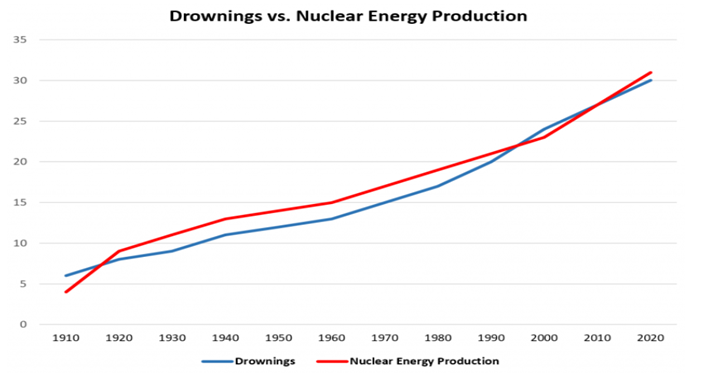
If we collect data for the total number of pool drownings each year and the total amount of energy produced by nuclear power plants each year, we find that the two variables are highly correlated. Does this mean that increased pool drownings are somehow causing more nuclear energy to be produced? Probably not. The more likely explanation is that global population has been increasing, which means more people are swimming and drowning in pools and nuclear energy production is increasing each year.
In a January 2000 paper for the Journal of Allergy and Clinical Immunology, researchers found that people with dark-colored cats suffered more allergic reactions than owners of light-colored cats. But the correlation appears to have just been a coincidence. Cat allergies are caused by a protein called Fel d 1, which is produced in salivary and sebaceous glands. A research team in New Zealand found that cat allergies simply aren’t related to cat color or hair length.
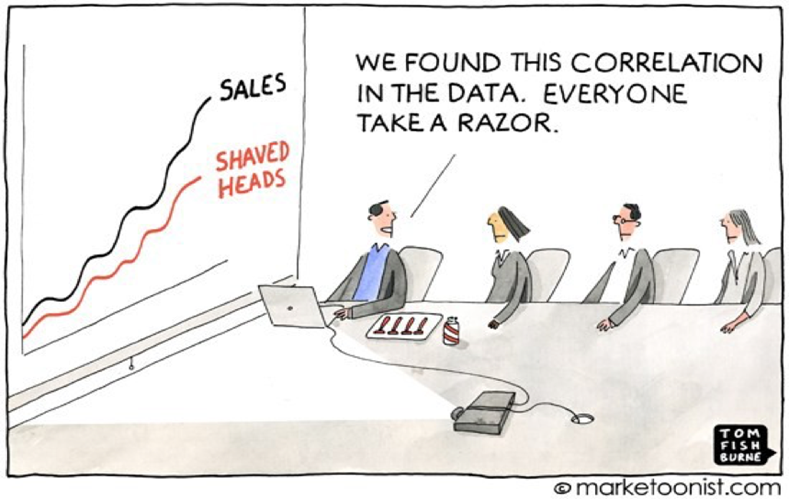
Consider the relationship between sales and shaved heads.
What is Causation?
Australian Bureau of Statistics defines causation as “one event is the result of the occurrence of the other event (i.e., there is a causal relationship between the two events). This is also referred to as cause and effect.”
Causation can be defined as the relationship between two variables where an observed event or action appears to have caused a second event or action. Causation is also known as cause and effect. In other words, causation is the relationship between something that happens and the thing that causes it to happen. The first phenomenon that happens is the cause and the second is the effect. While correlation is a mutual relationship between two things, causality is the action of causing something to happen. Causation goes a step further than correlation. It says any change in the value of one variable will cause a change in the value of another variable.
Causality is a concept that is frequently misunderstood, and it can be difficult to assume causation between two variables without doing a randomized controlled experience or an observational study. Furthermore, correlation can be a useful measure but has limitations as it is usually associated with measuring a linear relationship.
How can Causation be Established?
There are four criteria that need to be met for a correlation to be considered causal. These include the following:
1. The two variables must change together.
2. The relationship must be reasonable.
3. The cause must precede the effect in time.
4. The relationship must not be due to a third variable.
The most effective way to establish causality between variables is to perform a randomized, controlled experiment. In this experiment, the sample population is split into two groups with both groups being comparable in almost every way. The two groups then receive different treatments, and the outcomes of each group are evaluated. The critical assumption of this approach is that the two groups are homogenous and there are no noticeable differences between the two groups that would bias the result.
For example, in medical research, one group may receive a placebo while the other group is given a new type of medication. If the group given medication shows significant improvements and the group given the placebo shows no significant changes, the medication may have caused the improvements.
Another way to establish causality between variables is through observational studies. In these studies, we survey or measure members of a sample without trying to affect the members or manipulate the variables. We simply observe what is happening and record the observations. We do not randomly assign individuals to a group or apply any kind of treatment. The studies will look at the groups behaviors and outcomes and observe any changes over time.
For example, an article in the BBC News Health section described a study concerning dementia and “mid-life ills”. According to the article, researchers followed more than 11,000 people over a period of 12–14 years. They found that smoking, diabetes, and high blood pressure were all factors in the onset of dementia.
The objective of these studies is to provide statistical information in addition to other sources of information that will be required for establishing whether causality exists between two variables.
Some other examples where a case can be made for causation include the following:
There is a positive correlation between the number of hours you spend studying for a test and the grade you receive on the test. Here, there is a case for causation showing that if you spend more time studying, this will result in a higher grade.
There is a positive correlation between exercise and feeling exhausted. After I actively push my body doing exercises, I feel physically exhausted. This is a case for causation showing that physical exercise will result in feeling exhausted.
Causality is a very important principle that can be viewed as a means of predicting the future based on information about past events. Having knowledge about past events can help prevent or alter future outcomes.
Thanks so much for reading my article! If you have any comments or feedback, please add them below.
If you enjoy reading stories like these and want to support me as a writer, consider signing up to become a Medium member. Membership gives you unlimited access to stories on Medium. You can sign up using this link https://medium.com/@dniggl/membership


