
Connecting Calendar table to the Main table in Power BI
Power BI is a platform that allows you to connect to various data sources, transform and model your data, and create interactive dashboards and reports. Power BI can help you gain insights from your data and communicate them effectively.
What is a Calendar table in Power BI?
In Power BI, a calendar table is a specialized table that contains information about dates, such as year, month, day, and week, along with other relevant attributes like fiscal periods, holidays and working days. The purpose of a calendar table is to provide a framework for analyzing and visualizing data that is time-sensitive, such as sales, revenue or customer behavior. Power BI has made it mandatory to create and use a Calendar table whenever we are using Time Intelligence functions like TOTALYTD, DATEADD etc.

Creating the Calendar table connecting it to the Main table
We will be creating a Calendar table named Calender using CALENDAR functions in Power BI and then connecting it to our Main table named ecommerce_data.
1.DAX for calendar table creation:
Calender = CALENDAR(MIN(ecommerce_data[order_date]), MAX(ecommerce_data[order_date]))

The CALENDAR functions takes two arguments — StartDate and EndDate.
We will be providing these values based on the data in our Main table ecommerce_data. To get the StartDate we will use the MIN() function on the date column of our Main table which here is [order_date] so the overall reference becomes MIN(ecommerce_data[order_date]), similarly for EndDate we will use MAX() function with reference to Main table as MAX(ecommerce_data[order_date]). Overall the above DAX generates a table with a contiguous series of dates between start and end date, based on the data available in the data source.
2.Connecting the Calendar table to the Main table:
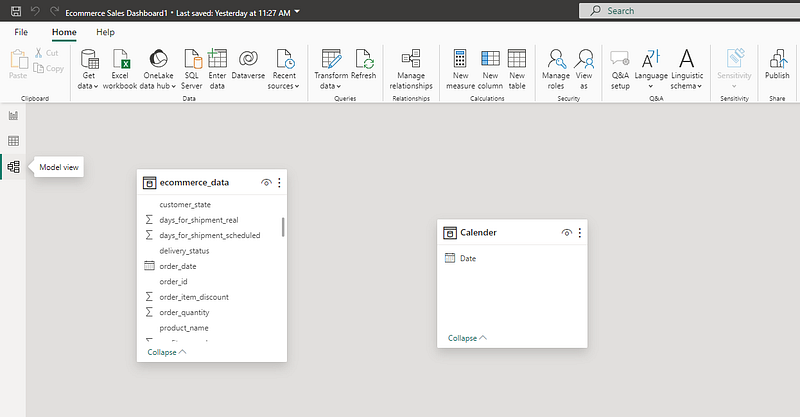
Now head to Model view in Power BI, there you will find your Main table ecommerce_data and the Calendar table Calender.
Now scroll the Main table to find order_date, then click on it and drag it to the Date column in Calendar table, vice versa will also do the task.
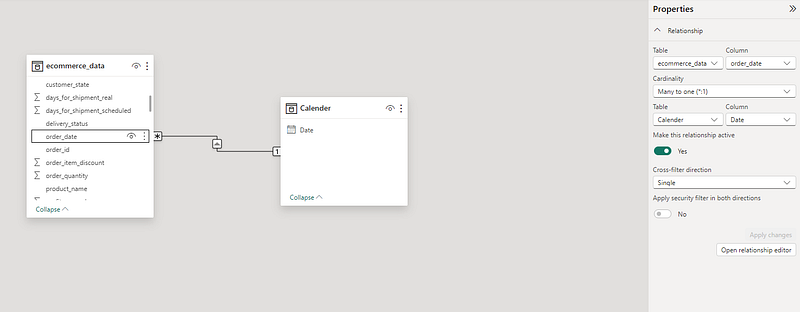
This creates a Many to one(*:1) relationship between the Main table and Calendar table because Calendar table has each date between StartDate and EndDate only once, but in the Main table each order_date may have multiple orders so there may be multiple connections from the Main table to a single date in Calendar table hence the relation is Many to one(*:1).
With this we have successfully connected our Calendar table to the Main table, you can have multiple connections with multiple tables in Power BI and further can use Time Intelligence functions like TOTALYTD to do your analysis or for creating dashboards.
To create a QoQ KPI refer to this link.
To create a PQTD KPI refer to this link.
To create a QTD KPI refer to this link.
To go to Part 1 of the Professional KPI series 3 refer to this link.
To create a KPI with a sign refer to this link.
To read more stories like this you can follow me with this link.
Don’t forget to subscribe to
👉 Power BI Publication
👉 Power BI Newsletter
and join our Power BI community
👉 Power BI Masterclass