
Confusion Matrix for Your Multi-Class Machine Learning Model
A beginner’s guide on how to calculate Precision, Recall, F1-score for a multi-class classification problem.

A confusion matrix is a tabular way of visualizing the performance of your prediction model. Each entry in a confusion matrix denotes the number of predictions made by the model where it classified the classes correctly or incorrectly.
Anyone who is already familiar with the confusion matrix knows that most of the time it is explained for a binary classification problem. Well, this explanation is not one of them. Today we will see how does a confusion matrix work on multi-class machine learning models. However, we will start with a little background using a binary classification just to put things in perspective.
Confusion Matrix for Binary Classification

As you can see, a binary classification problem has only two classes to classify, preferably a positive and a negative class. Now let’s look at the metrics of the Confusion Matrix.
True Positive (TP): It refers to the number of predictions where the classifier correctly predicts the positive class as positive.
True Negative (TN): It refers to the number of predictions where the classifier correctly predicts the negative class as negative.
False Positive (FP): It refers to the number of predictions where the classifier incorrectly predicts the negative class as positive.
False Negative (FN): It refers to the number of predictions where the classifier incorrectly predicts the positive class as negative.
It’s always better to use confusion matrix as your evaluation criteria for your machine learning model. It gives you a very simple, yet efficient performance measures for your model. Here are some of the most common performance measures you can use from the confusion matrix.
Accuracy: It gives you the overall accuracy of the model, meaning the fraction of the total samples that were correctly classified by the classifier. To calculate accuracy, use the following formula: (TP+TN)/(TP+TN+FP+FN).
Misclassification Rate: It tells you what fraction of predictions were incorrect. It is also known as Classification Error. You can calculate it using (FP+FN)/(TP+TN+FP+FN) or (1-Accuracy).
Precision: It tells you what fraction of predictions as a positive class were actually positive. To calculate precision, use the following formula: TP/(TP+FP).
Recall: It tells you what fraction of all positive samples were correctly predicted as positive by the classifier. It is also known as True Positive Rate (TPR), Sensitivity, Probability of Detection. To calculate Recall, use the following formula: TP/(TP+FN).
Specificity: It tells you what fraction of all negative samples are correctly predicted as negative by the classifier. It is also known as True Negative Rate (TNR). To calculate specificity, use the following formula: TN/(TN+FP).
F1-score: It combines precision and recall into a single measure. Mathematically it’s the harmonic mean of precision and recall. It can be calculated as follows:
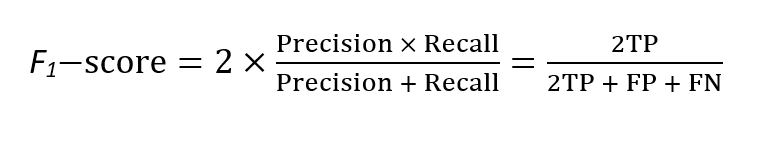
Now, in a perfect world, we’d want a model that has a precision of 1 and a recall of 1. That means a F1-score of 1, i.e. a 100% accuracy which is often not the case for a machine learning model. So what we should try, is to get a higher precision with a higher recall value. Okay, now that we know about the performance measures for confusion matrix, Let’s see how we can use that in a multi-class machine learning model.
Confusion Matrix for Multi-Class Classification
For simplicity’s sake, let’s consider our multi-class classification problem to be a 3-class classification problem. Say, we have a dataset that has three class labels, namely Apple, Orange and Mango. The following is a possible confusion matrix for these classes.

Unlike binary classification, there are no positive or negative classes here. At first, it might be a little difficult to find TP, TN, FP and FN since there are no positive or negative classes, but it’s actually pretty easy. What we have to do here is to find TP, TN, FP and FN for each individual class. For example, if we take class Apple, then let’s see what are the values of the metrics from the confusion matrix.
- TP = 7
- TN = (2+3+2+1) = 8
- FP = (8+9) = 17
- FN = (1+3) = 4
Since we have all the necessary metrics for class Apple from the confusion matrix, now we can calculate the performance measures for class Apple. For example, class Apple has
- Precision = 7/(7+17) = 0.29
- Recall = 7/(7+4) = 0.64
- F1-score = 0.40
Similarly, we can calculate the measures for the other classes. Here is a table that shows the values of each measure for each class.

Now we can do more with these measures. We can combine the F1-score of each class to have a single measure for the whole model. There are a few ways to do that, let’s look at them now.
Micro F1
This is called micro-averaged F1-score. It is calculated by considering the total TP, total FP and total FN of the model. It does not consider each class individually, It calculates the metrics globally. So for our example,
- Total TP = (7+2+1) = 10
- Total FP = (8+9)+(1+3)+(3+2) = 26
- Total FN = (1+3)+(8+2)+(9+3) = 26
Hence,
- Precision = 10/(10+26) = 0.28
- Recall = 10/(10+26) = 0.28
Now we can use the regular formula for F1-score and get the Micro F1-score using the above precision and recall.
Micro F1 = 0.28
As you can see When we are calculating the metrics globally all the measures become equal. Also if you calculate accuracy you will see that,
Precision = Recall = Micro F1 = Accuracy
Macro F1
This is macro-averaged F1-score. It calculates metrics for each class individually and then takes unweighted mean of the measures. As we have seen from figure “Precision, Recall and F1-score for Each Class”,
- Class Apple F1-score = 0.40
- Class Orange F1-score = 0.22
- Class Mango F1-score = 0.11
Hence,
Macro F1 = (0.40+0.22+0.11)/3 = 0.24
Weighted F1
The last one is weighted-averaged F1-score. Unlike Macro F1, it takes a weighted mean of the measures. The weights for each class are the total number of samples of that class. Since we had 11 Apples, 12 Oranges and 13 Mangoes,
Weighted F1 = ((0.40*11)+(0.22*12)+(0.11*13))/(11+12+13) = 0.24
Finally, let’s look at a script to calculate these measures using Python’s Scikit-learn.
Here is the output of the script.

Note: Scikit-Learn uses the rows to be the “true class” and the columns to be the “predicted class.” This is opposite to our consideration for the Apple, Orange and Mango example, but logically similar. You can consider true and predicted class either way. But if you are using Scikit-Learn, then you have to play by their rules.
Hope you found what you were looking for. Thanks for reading.


