
Complete Guide To Build Real-Time Alerting, Monitoring System

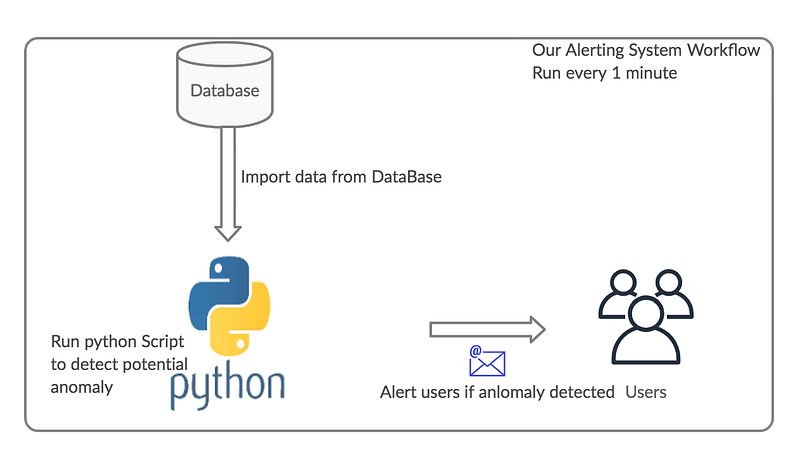
In different fields, we need an efficient alerting, monitoring system to identify potential anomaly, fraud or extreme values. In this tutorial, we gonna explain you how build a good real-time alerting system.
All script is available there : https://github.com/Faouzizi/Alerting-System
I. Introduction
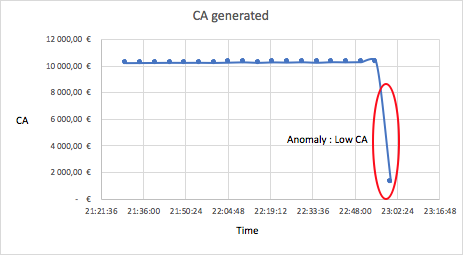
When you work with time series like Sales series, number of transactions, CA generated or some thing like that, you often face a very annoying problem : undetected anomaly.
So in this short tutorial, i gonna show you a simple way to create and customize your own alerting system.
All our scripts are there : https://github.com/Faouzizi/Alerting-System
II. Model the time series
The first step we need importing data from MySQL server or other source of data:
####################################################################
###########               Import python packages
####################################################################
import pandas as pd
import mysql.connector as MySQLdb
import config

####################################################################
###########               Import python packages
####################################################################
def import_data(req, db_name):
    try:
        conn = MySQLdb.connect(user=config.mysql_user, host=config.mysql_host, password=config.mysql_password, db=config.mysql_db)
        print('Connection ok')
    except:
        print("I am unable to connect to the database")
    try:
        cur = conn.cursor()
        cur.execute(req)
        results = cur.fetchall()
    finally:
        conn.close()
    data = pd.DataFrame(list(results), columns=[row[0] for row in cur.description]).reset_index(drop=True)
    return (data)
After that, we need to process the time series imported and modelize it. Then we can predict the next value of the time series with a 95% IC, if the real value is not in this IC so an anomaly is detected and we send an alerting email else nothing to do.
a. Process time series
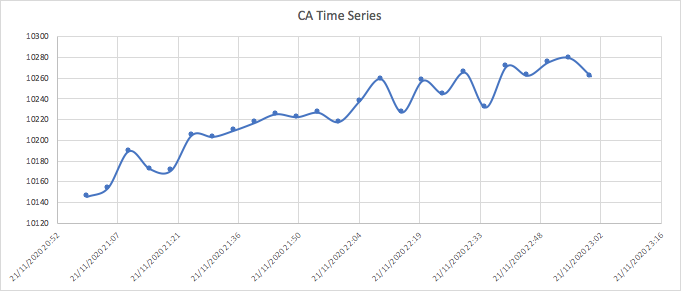
The first step of our modeling is the processing of our time series by processing the extreme values. We will therefore identify the extreme values and replace them with more consistent values. In our case, we are going to replace them with a value which is the average of the preceding value and the following value (You can use more complex model if you want).
To identify extreme values, we gonna use quantiles: let Q1 and Q3 respectively be the first quartile and the third quartile, then we can define an extreme value as being any value located outside the interval [Q1 — k * (Q3-Q1); Q1 + k * (Q3-Q1)] where k in a positive integer.
def traiter_valeurs_extremes_continues(df, variable):
    ###############################################################
    # This function allow you to treat extreme values by replacing
    # them by mean
    ###############################################################
    q1 = df[variable].quantile([0.25]).values[0]
    q3 = df[variable].quantile([0.75]).values[0]
    IC_valeur_non_aberantes = [q1 - 2*(q3-q1), q3 + 2*(q3-q1)]
    df.loc[df[variable]<IC_valeur_non_aberantes[0], variable] =
                                               df[variable].mean()
    df.loc[df[variable]>IC_valeur_non_aberantes[1], variable] =
                                               df[variable].mean()
    return(df[variable])
After that, our time series is ready for modeling :
b. Build a model
In this section, we will use Prophet package to fit our model and use it to predict the next value (you can use any other ML model).
Step 1: In this step, we gonna build our model using Prophet, so we start by renaming columns like this :
# we rename variables for Prophet package
df_temp.rename(columns={'sellTime':'ds','CA':'y'}, inplace=True)
Then we build our model :
model_fb = Prophet()Step 2: In this step, we will fit our model without the last value. We dont use the last value because we want know if this is an extreme value (anomaly) or not.
# an extreme value or not
    model_fb.fit(df_temp[['ds','y']][:-1])
Step 3: Predict the value of the last value and define our confidence interval:
# we predict the next value using our model
future = model_fb.make_future_dataframe(periods=1, freq='5min')
forecast = model_fb.predict(future)
# there we have our confidence intervall
df = pd.merge(df,forecast[['ds','yhat','yhat_lower', 'yhat_upper']], how='inner', left_on='sellTime', right_on='ds')
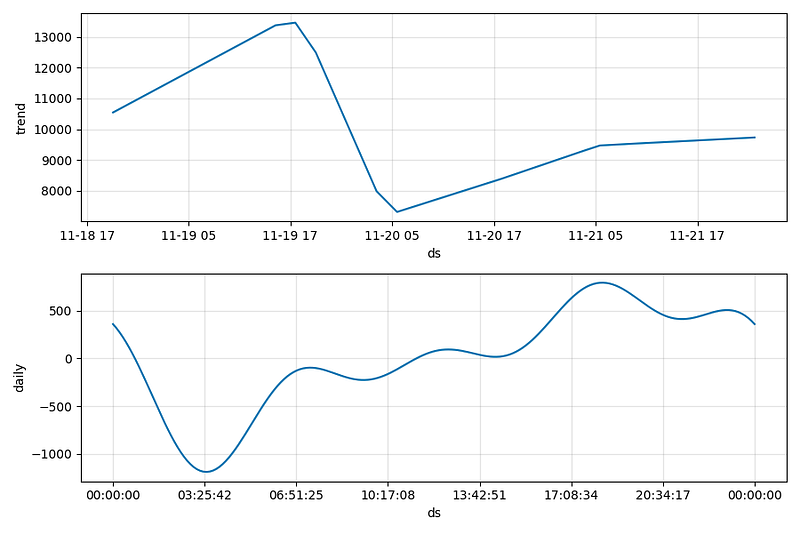
Here we can see, forecast components using Prophet.plot_components method:
fig2 = model_fb.plot_components(forecast)Step 4: For the last value, check if the real value is in the confidence interval or not. If the real value is out this interval, we detect an anomaly and we should send an alert. We can have 2 anomaly type, an high volume or low volume.
# we create 2 new variables
df['alert_high'] = 0
df['alert_low'] = 0
# dectect the anomaly if the last value is out of IC
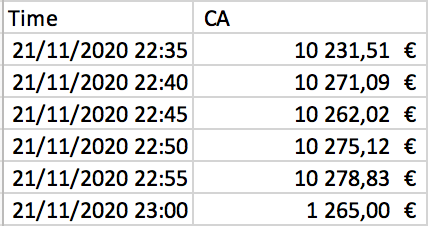
df.loc[df.shape[0]-1,'alert_high'] = 1 if df['CA'].iloc[-1] >
df['yhat_upper'].iloc[-1] else 0
df.loc[df.shape[0]-1,'alert_low'] = 1 if df['CA'].iloc[-1]<
df['yhat_lower'].iloc[-1] else 0Step 5: If we detect an anomaly, then the last step is to inform the responsible team via e-mail.
c. Send e-mail
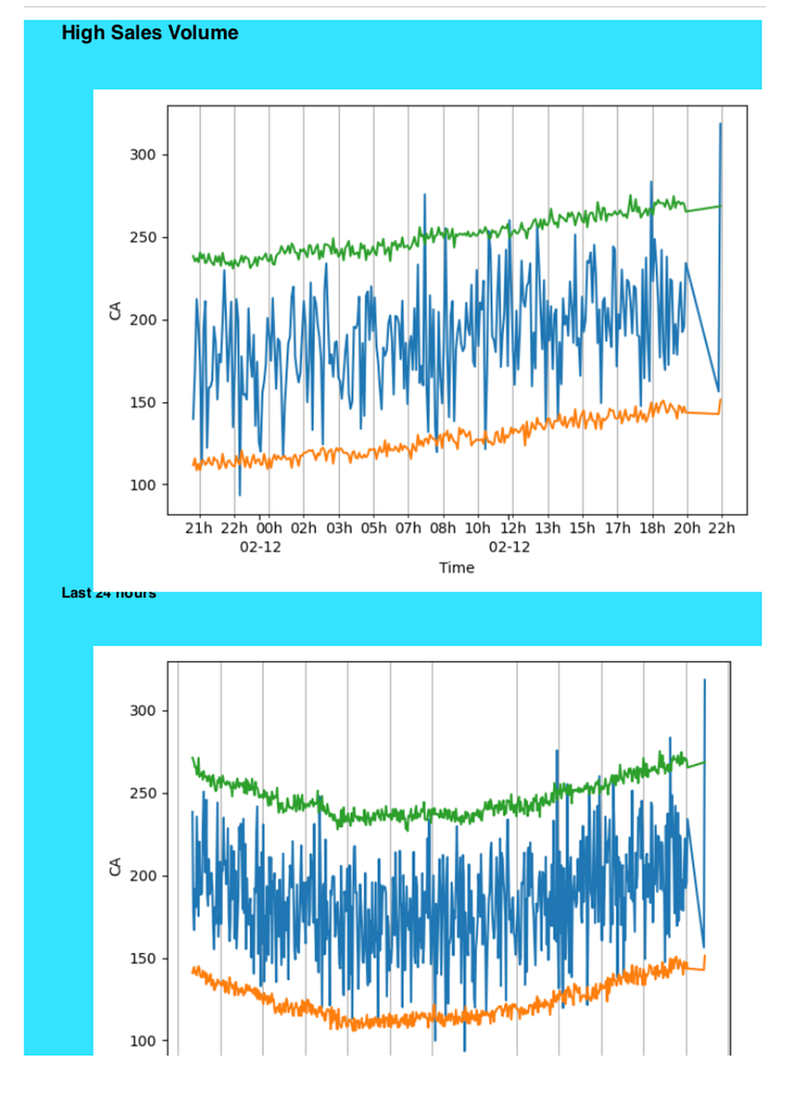
The aim of this section is to explain how we can send an e-mail to the responsible team with time series plots when we detect an anomaly. The plots will show the importance of the anomaly.
Step 1: Plot time series and save them
#############################################################################
###########               Import python packages
#############################################################################
import matplotlib.pyplot as plt
from matplotlib.ticker import (MultipleLocator, FormatStrFormatter, AutoMinorLocator)
import matplotlib.dates as mdates
import matplotlib.ticker as ticker

#############################################################################
###########               Plot time series using last 24 or 48 hour
#############################################################################
def plot_figure(nb_hour, df):
    if nb_hour==24:
        df_24 = df[-nb_hour*12:]
        fig, ax = plt.subplots()
        ax.xaxis.grid(True, which='minor')
        ax.plot(df_24.index, df_24)
        ax.set_xlabel('Time')
        ax.set_ylabel('CA')
        ax.xaxis.set_major_locator(MultipleLocator(0.5))
        ax.xaxis.set_major_formatter(mdates.DateFormatter('\n %d-%m'))
        ax.xaxis.set_minor_locator(MultipleLocator(0.07))
        ax.xaxis.set_minor_formatter(mdates.DateFormatter('%Hh'))
        plt.tight_layout()
        plt.savefig('./plots/plot_24h.png')
    else:
        df_48 = df[-nb_hour*12:]
        fig, ax = plt.subplots()
        ax.xaxis.grid(True, which='minor')
        ax.plot(df_48.index, df_48)
        ax.set_xlabel('Time')
        ax.set_ylabel('CA')
        ax.xaxis.set_major_locator(MultipleLocator(1))
        ax.xaxis.set_major_formatter(mdates.DateFormatter('\n %d-%m'))
        ax.xaxis.set_minor_locator(MultipleLocator(0.17))
        ax.xaxis.set_minor_formatter(mdates.DateFormatter('%Hh'))
        plt.tight_layout()
        plt.savefig('./plots/plot_48h.png')
Step 2: Create a html template including e-mail content There, we adapt the template according to the anomaly type. If we have a low volume, the title will be “Low sales volume” and the color will be orange and if the anomaly is high volume, the title will be “High sales volume” and the color will be blue.
######################################################################### Import python packages ####################################################################
from string import Template
import base64
######################################################################### Build the email content using html
####################################################################def get_html_template(type_alert):

    # Import of time series plots
    data24h_uri = base64.b64encode(open('./plots/plot_24h.png',
                                   'rb').read()).decode('utf-8')
    data48h_uri = base64.b64encode(open('./plots/plot_48h.png',
                                   'rb').read()).decode('utf-8')
    img24h_tag = '<img src="data:image/png;base64,
                                         {0}">'.format(data24h_uri)
    img48h_tag = '<img src="data:image/png;base64,{0}"
                                height="auto"> '.format(data48h_uri)
# Choice of the email color, orange for low sales and blue for
# high sales
if type_alert=='Low':
color = '#F7F8E0'
else:
color = '#33E3FF' # Html email contents
message = """
<!DOCTYPE html>
<html>
<head>
<title>Volume Alert</title>
</head>
<body style="background-color: #F7F8E0">
<header style="background-color: """+color+"""">
<h1 >"""+type_alert+""" Sales Volume</h1>
</header>
<div style="background-color: """+color+""";">
<br>
<div style="position: relative; top: 20px; left: 30px;">
"""+img24h_tag+"""
</div>
<h2>Last 24 hours</h2>
</div>
<div style="background-color: """+color+""";">
<br>
<div style="position: relative; top: 20px; left: 30px;">
"""+img48h_tag+"""
</div>
<h2>Last 48 hours</h2>
</div>
<footer style="background-color: gray;">
<p style="text-align: center;">Contact us on : <a href="mailto:[email protected]">[email protected]</a></p>
</footer
</body>
</html>
"""
return(Template(message))Step 3: Send the e-mail
####################################################################
###########               Import python packages
####################################################################
import smtplib
import config
from utils.get_templates import get_html_template
from email.mime.multipart import MIMEMultipart
from email.mime.text import MIMEText

####################################################################
###########               Send the email
####################################################################
def send_alerting_email(alert_message,type_alert):
    # get the email content created on step 2
    message_template = get_html_template(type_alert)
#connect to the SMTP server
s = smtplib.SMTP(host='smtp.gmail.com', port=587)
s.starttls()
s.login(config.smtp_email, config.smtp_password) # Send the email for each email on the recipient list
for email in config.recipient_list:
msg = MIMEMultipart() # create a message
# add in the actual person name to the message template
message = message_template.substitute()
# setup the parameters of the message
msg['From']=config.smtp_email
msg['To']=email
msg['Subject'] = alert_message
# add in the message body
msg.attach(MIMEText(message, 'html'))
# send the message via the server set up earlier.
s.send_message(msg)
del msg
# Terminate the SMTP session and close the connection
s.quit()
return('email sent :)')Just below you have an example of an email received during high volume anomaly. We will receive the same kind of email when a low volume anomaly will be detected.
III. Mise en production
The last part of this project is to automate the job so that it runs every minute. For that we will use two approaches the first one is automate using crons and the next one using Rundeck.
- Method N°1 : Crons So here we will use crontab to automate our job. The only job we will run is main.py (go to github to see this python file :https://github.com/Faouzizi/Alerting-System) In you server ou terminal run the following command lines :
- crontab -l # this command line will show you all running crons
- crontab -e # this command line will let you edit crons
# past this command line to run your main file every mintues- * * * * * env mysql_user='xxxxx' mysql_password='xxxxx' mysql_host='xxxxx' smtp_password='xxxxx' mysql_db='xxxxx' smtp_email='xxxxx' recipient_lis='xxxxx' python3 main.pyIf you wants more informations about crons go there : https://readmedium.com/scheduling-jobs-using-crontab-844c7e135d97
Scripts are there : https://github.com/Faouzizi/Alerting-System
Don’t forget to like and comment this article if you have any question, i will answer it.
2. Method N°2 : Rundeck
If you prefer, you can use Rundeck to automate job to run every 1 minute. I will explain how use Rundeck in the next article.
Conclusion : There, we terminate our article about a real time alerting system. Now you can build yours. If you have a question don’t hesitate to ask me 😄

Are you new on Medium ? Don’t hesitate to subscribe for less than $ 5 here to benefit without limits and improve your skills.


