
Compare Dependency of Categorical Variables with Chi-Square Test (Stat-12)
Complete Guideline to Find Dependencies among Categorical Variables with Chi-Square Test

Motivation
Many statistical tests are available, like the p-test, z-test, students’ t-test, ANOVA test, etc. Why do we need the Chi-Square test? None of the above tests show the dependency of categorical variables. Chi-Square test is the best statistical weapon for doing the job. The main idea behind the test is the following clause [2]—
“Goodness of fit.”
Let’s make it a little bit easier with an example. Suppose you toss a coin 18 times. Generally, the probability of the outcome of head and tail is o.5. So, the probability says if you toss a coin 18 times, you should get 9 times head and 9 times tail. But you observed the occurrence of the head is 12 times instead of 9 times. That means there is a difference between the expected and the observed value. Chi-Square test shows how close our observed and expected value is!
Chi-Square Test (X²)
The Chi-Square test is a test that identifies whether there are any significant differences between the observed number of occurrences of an event and the expected number of occurrences or not. According to Wikipedia —
Pearson’s chi-squared test is used to determine whether there is a statistically significant difference between the expected and observed frequencies in one or more categories of a contingency table [1].
In 1900, Karl Pearson wrote a paper [2] on the Chi-Square test —
On the criterion that a given system of deviations from the probable in the case of a correlated system of variables is such that it can be reasonably supposed to have arisen from random sampling
The title is a little bit longer and hard to realize. So, he also expressed the objective of the test by saying —
“The object of this paper is to investigate a criterion of the probability on any theory of an observed system of errors, and apply it to the determination of goodness of fit in the case of frequency curves.”
Karl Pearson never used the name Chi-Square in the test, and he just used the symbol X² to represent the test. After that, according to the name of the Greek letter X, people call the test Chi-Square.
The formula for calculating the Chi-Square (X²) is simple.

Where, O is the observed value, and the E is the expected value.
Chi-Square distribution
There is a standard value for Chi-Square distribution. With the standard value, we decide whether we accept or reject our hypothesis. The tutorial [3] helps me to implement the distribution with ease. Let’s try to plot the distribution with some lines of Python code.
Output
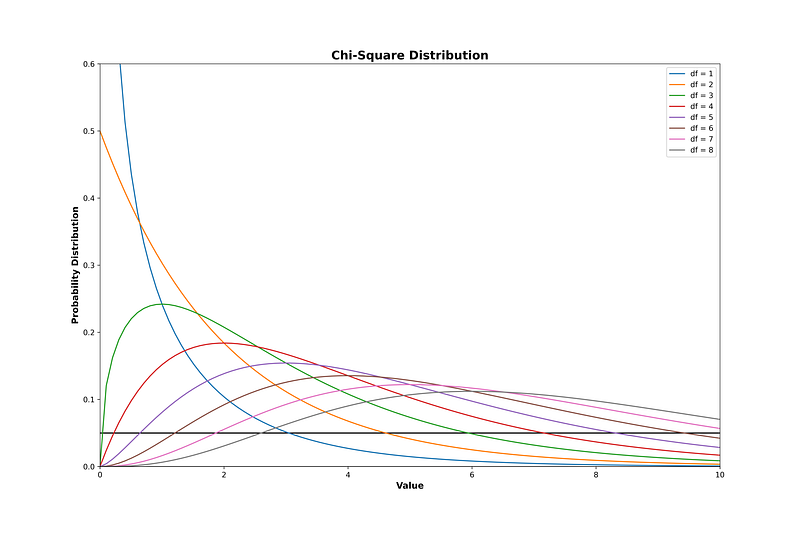
The lines show the distribution of the Chi-Square value for different degrees of freedom. The horizontal line intersects the curves, and intersection points indicate the critical value of individual degrees of freedom.
Let’s do some calculations and implement the chi-square test in python. The article on Chi-Square provides a guideline for implementation [4].
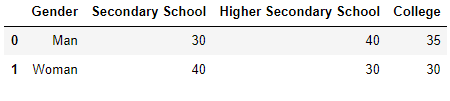
Suppose you have some data on the level of education and gender, as shown below.
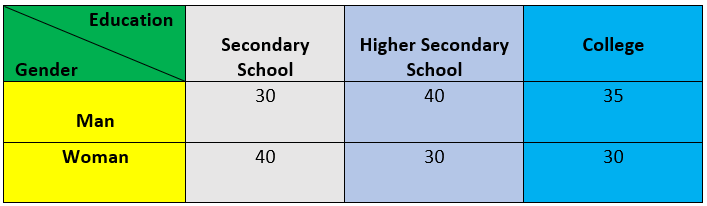
Based on the above data, we want to determine if there are any significant differences between man and woman based on education level.
Step by Step Calculation for X² Value Calculation
Hypothesis
Null Hypothesis → There is no significant difference between Gender and Education level.
Alternative Hypothesis → There is significant difference between Gender and Education level.
Firstly, we will calculate the row total and column total.
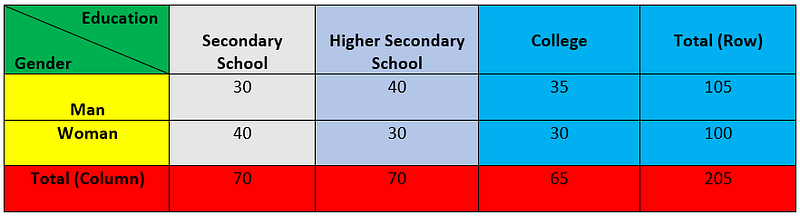
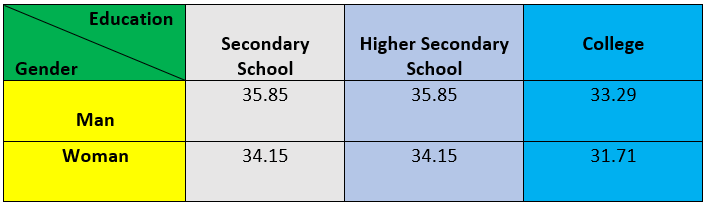
Now, we need to calculate the expected value for each entry. It can be calculated by the following formula.

In our case, Grand Total =205. So, the expected value for Gender → Man and Education → Secondary School is (105 x 70)/205 = 35.85. If we calculate all the values, we will get the values as shown in the table.
Finally, we will calculate the Chi-Square value by applying the formula.
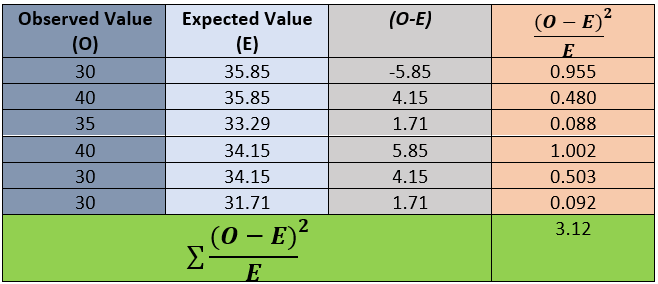
For the given data, our calculated Chi-Square (X²) value is 3.12. Degree of freedom can be associated with the number of levels of education (Secondary, Higher Secondary, and college) and gender (Man and Woman). So, the degree of freedom is = (3–1)x(2–1) = 2.
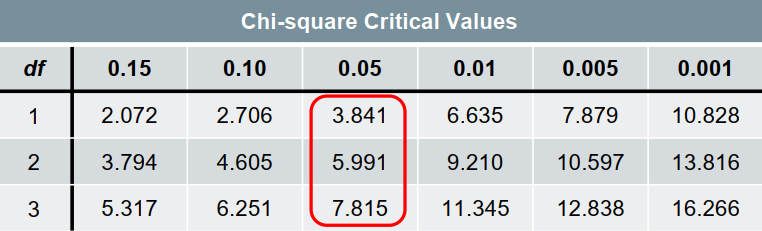
- The critical value of X² for 2 degrees of freedom with a 95% confidence level is 5.991.
Here, X² < X²-critical.
The result shows that we can’t reject the null hypothesis. So, we can conclude that there is no significant difference between gender and level of education.
Implementation with python
Let’s create the dataset.
import pandas as pd
data=pd.DataFrame([['Man',30,40,35],['Woman',40,30,30]],columns=['Gender','Secondary School','Higher Secondary School','College'])
Output
We will use Python’s Scipy library by importing the chi2_contingency module. The module works only on numerical values. So, we need to extract only the numeric values.
data.iloc[:,1:].valuesThe above code will do the job. It’s time to fit the chi2_contingency model.
from scipy.stats import chi2_contingency
stat, p, dof, expected = chi2_contingency(data.iloc[:,1:].values)

print('The Chi-Square value is {:.3f}.\nDegree of freedom is {}.\nExpected table value is \n {}'.format(stat,dof,expected)
Output
The Chi-Square value is 3.122.
Degree of freedom is 2.
Expected table value is
 [[35.85365854 35.85365854 33.29268293]
 [34.14634146 34.14634146 31.70731707]]
It shows the same result as our hands on calculation. Let’s try to visualize the output.
Output
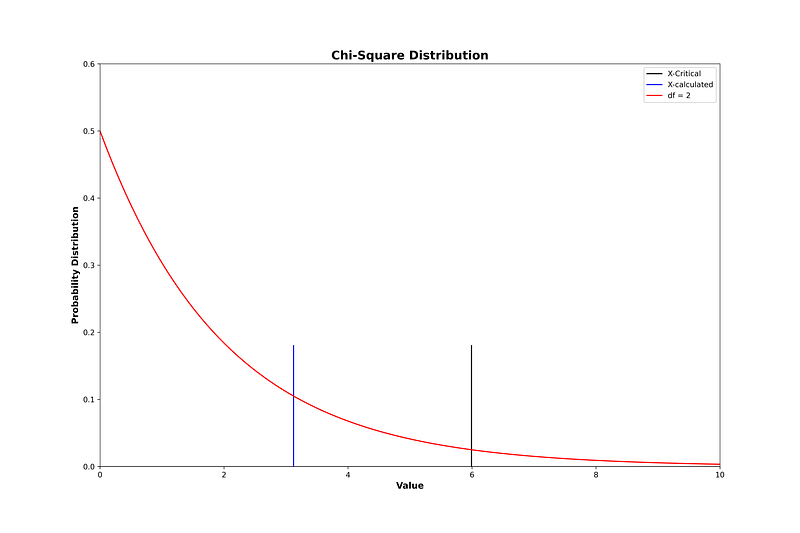
The right side of the black vertical line is the rejection region, and the left side of the line is the acceptance region of the null hypothesis. As our calculated Chi-Square value falls in the acceptance region, we can’t reject the null hypothesis.
Conclusion
Statistics is an interesting technique for reasoning a population from sample data. Without statistics, we can’t build a prediction model as prediction models provide us an insight into future outcomes with the help of past data. However, different statistical techniques and tests are used to analyze different things. The Chi-Square test helps us to show the relations between two categorical variables.
[N.B: Instructions of Jose Portilla, on Chi-Square test helps me to make the concept clear.]
References
- https://en.wikipedia.org/wiki/Chi-squared_test
- Karl Pearson F.R.S. (1900) X. On the criterion that a given system of deviations from the probable in the case of a correlated system of variables is such that it can be reasonably supposed to have arisen from random sampling, The London, Edinburgh, and Dublin Philosophical Magazine and Journal of Science, 50:302, 157–175, DOI: 10.1080/14786440009463897
- Python — Chi-Square Test (tutorialspoint.com)
- Python — Pearson’s Chi-Square Test — GeeksforGeeks
Complete series of articles on statistics for Data Science
- Less is More; the ‘Art’ of Sampling (Stat-01)
- Get Familiar with the Most Important Weapon of Data Science ~Variables (Stat-02)
- To Increase Data Analysing Power You Must Know Frequency Distribution (Stat-03)
- Find the Patterns of a Dataset by Visualizing Frequency Distribution (Stat-04)
- Compare Multiple Frequency Distributions to Extract Valuable Information from a Dataset (Stat-05)
- Eliminate Your Misconception about Mean with a Brief Discussion (Stat-06)
- Increase Your Data Science Model Efficiency With Normalization (Stat-07)
- Basic Probability Concepts for Data Science (Stat-08)
- Road Map from Naive Bayes Theorem to Naive Bayes Classifier (Stat-09)
- All You Need To Know About Hypothesis Testing for Data Science Enthusiasts (Stat-10)
- Statistical Comparison Among Multiple Groups With ANOVA (Stat-11)
- Compare Dependency of Categorical Variables with Chi-Square Test (Stat-12)
You may subscribe with the following link for getting each and every article on medium.


