
Collect and View Logs with Grafana Loki
No war in Ukraine. Stop Russia!

Preface.
Loki is a horizontally-scalable, highly-available, multi-tenant log aggregation system inspired by Prometheus. It is designed to be very cost effective and easy to operate. It does not index the contents of the logs, but rather a set of labels for each log stream.
Compared to other log aggregation systems, Loki:
- does not do full-text indexing on logs. By storing compressed, unstructured logs and only indexing metadata, Loki is simpler to operate and cheaper to run.
- indexes and groups log streams using the same labels you’re already using with Prometheus, enabling you to seamlessly switch between metrics and logs using the same labels that you’re already using with Prometheus.
- is an especially good fit for storing Kubernetes Pod logs. Metadata such as Pod labels is automatically scraped and indexed.
- has native support in Grafana (needs Grafana v6.0).
A Loki-based logging stack consists of 3 components:
promtailis the agent, responsible for gathering logs and sending them to Loki.lokiis the main server, responsible for storing logs and processing queries.- Grafana for querying and displaying the logs.
In this article, we will install Grafana, Loki and collect logs from another container using Minikube.
Step 1. Grafana Deployment
Download configs for installing Grafana in Kubernetes from the tutorial git repository:
$ git clone https://[email protected]/oleksii_y/tutorial-grafana-loki.gitGo tutorial-Grafana-Loki folder to apply configs:
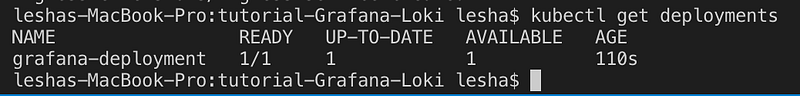
$ cd tutorial-Grafana-Loki && kubectl apply -f grafanaYou should see something like this:

When grafana deployment will be ready
add this line to your hosts:
192.168.99.100 grafana.local192.168.99.100 is Minikube IP
$ minikube ip
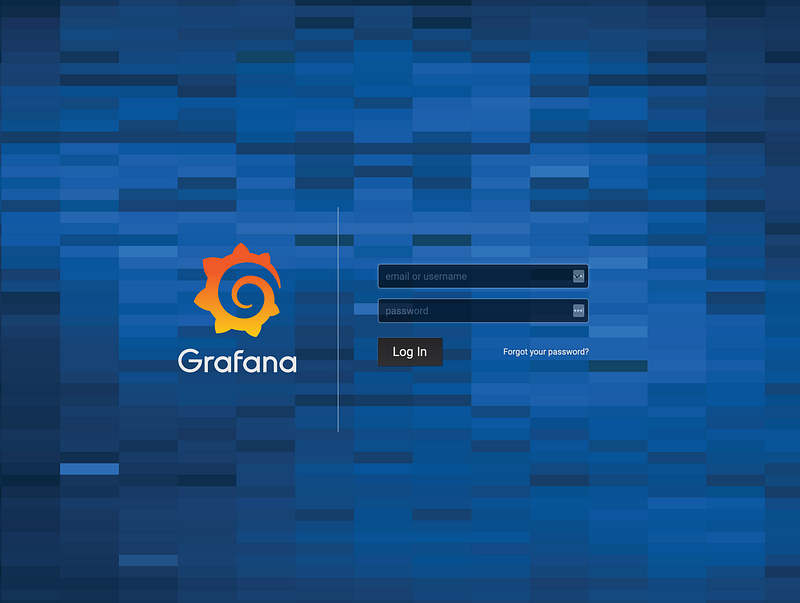
192.168.99.100Now you can type grafana.local in your browser and access Grafana (default username and password is admin/admin)
Step 2. Loki Deployment
Make sure you have the helm configure on your cluster:
$ helm initClone grafana/loki repository and navigate to production helm directory:
git clone https://github.com/grafana/loki.git && cd loki/production/helmDeploy Loki and Promtail to your cluster:
helm install . -n loki --namespace <YOUR-NAMESPACE>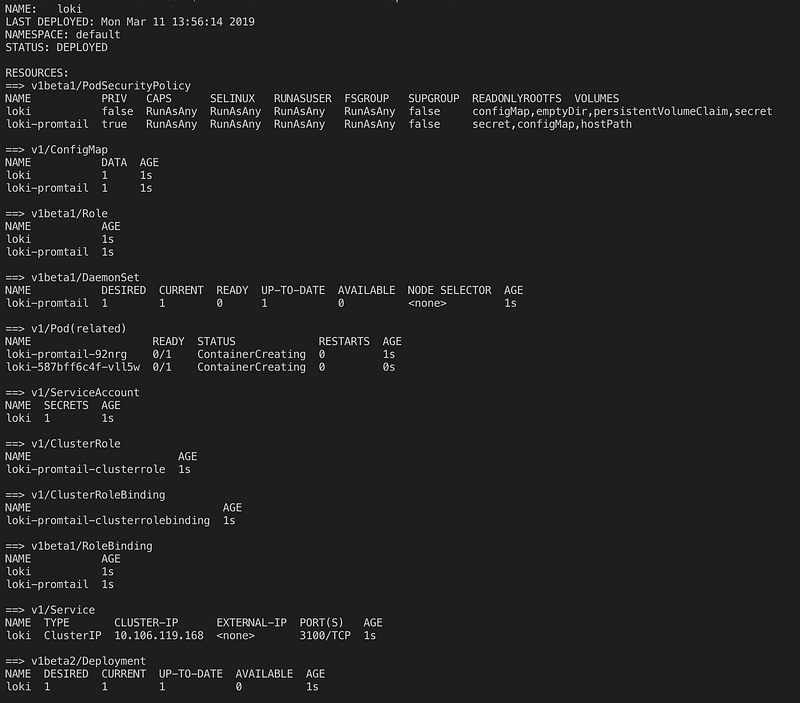
3. Add Loki as Data Source in Grafana
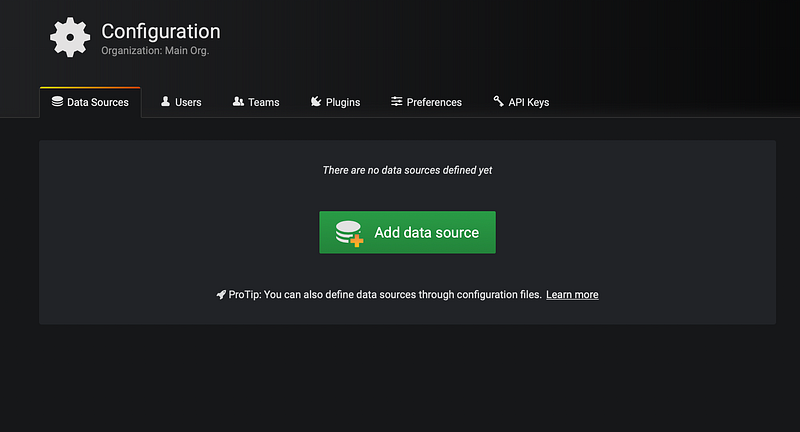
Click the gear icon and go to Configuration.
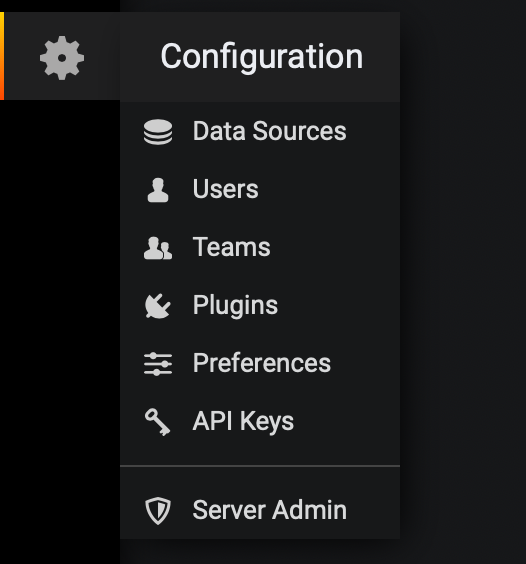
Press Add data source button.
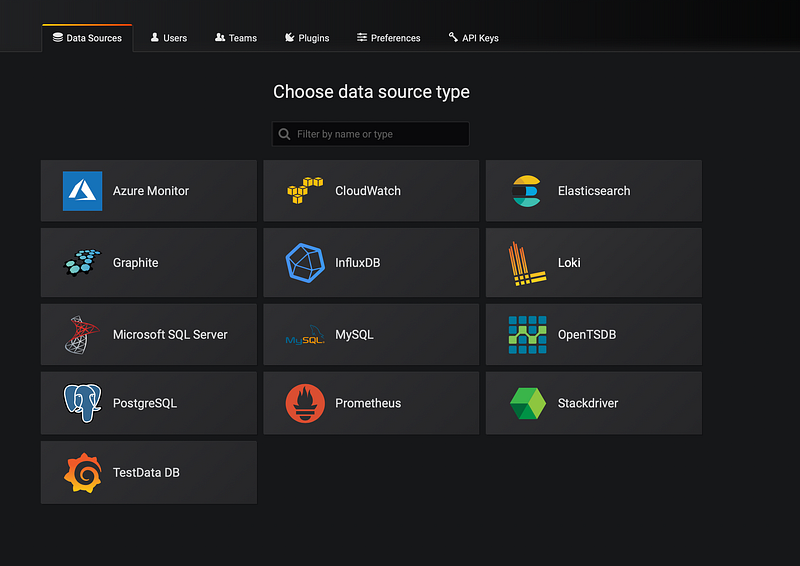
Then choose Loki.
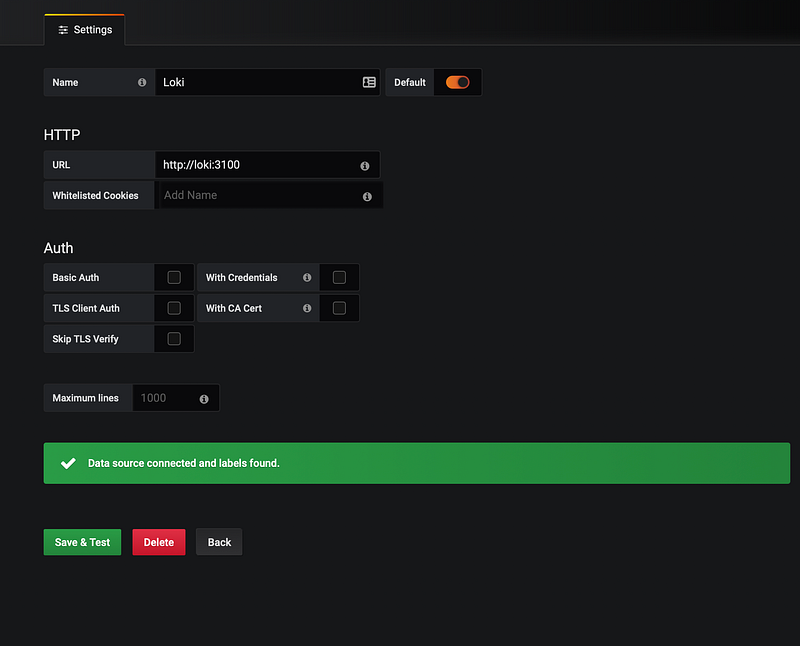
Add as the URL http://loki:3100 and press Save & Test
Click Explore icon
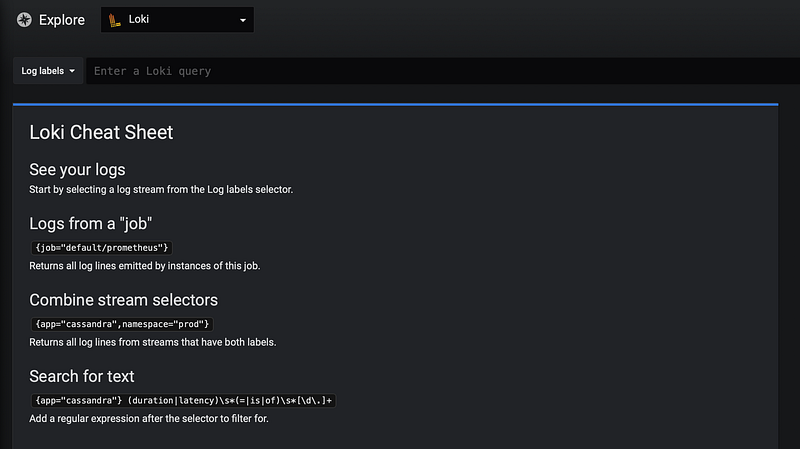
Check existing logs, just open Log labels:
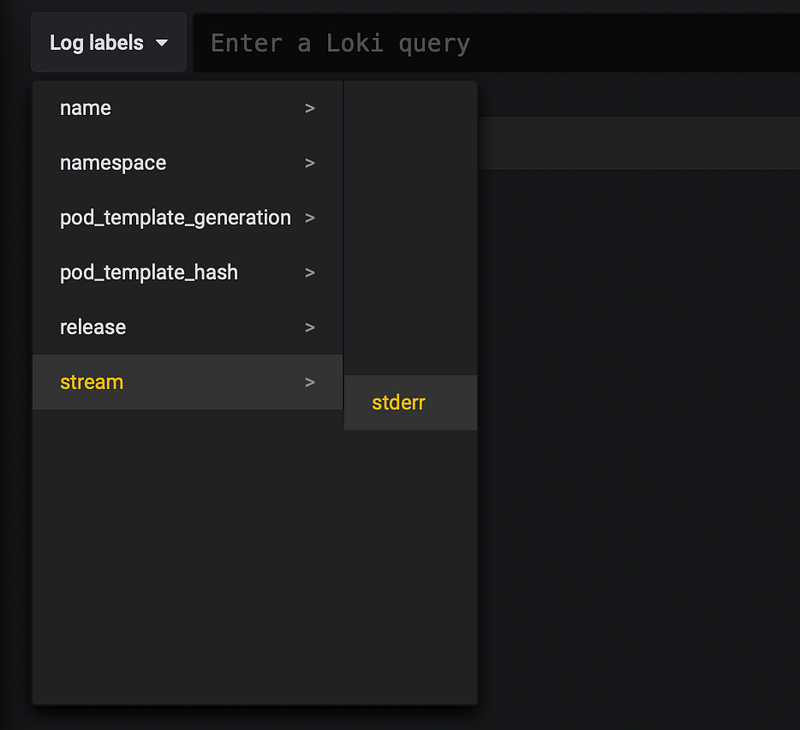
Let's look all stderr:
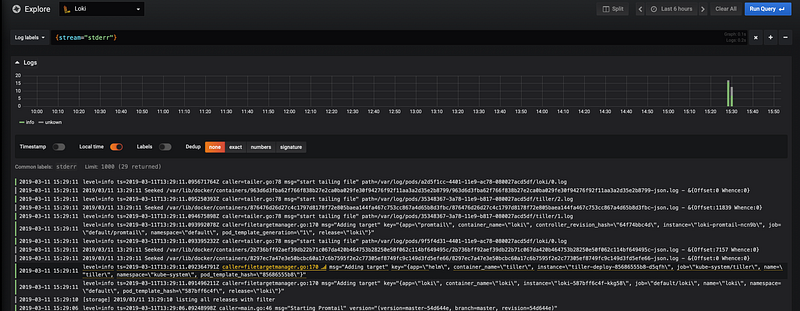
You can find all necessary files here
Thank you for reading!


