Coding the Volatility-Adjusted RSI in TradingView.
How to Code the RSI/ATR Using Pine Script.

Structured indicators are the result of fusing two or more together to form a weighted or adjusted indicator that takes into account more variables. For example, we know that there is a Stochastic-RSI indicator which combines the two formulas together in an attempt to improve the signals, this article discusses the creation of an RSI-ATR indicator which adjusts the RSI for the average true range, a measure of volatility.
I have just published a new book after the success of my previous one “New Technical Indicators in Python”. It features a more complete description and addition of structured trading strategies with a GitHub page dedicated to the continuously updated code. If you feel that this interests you, feel free to visit the below Amazon link, or if you prefer to buy the PDF version, you could contact me on LinkedIn.
The Volatility-Adjusted RSI
The RSI is without a doubt the most famous momentum indicator out there, and this is to be expected as it has many strengths especially in ranging markets. It is also bounded between 0 and 100 which makes it easier to interpret. Also, the fact that it is famous, contributes to its potential. This is because the more traders and portfolio managers look at the RSI, the more people will react based on its signals and this in turn can push market prices. Of course, we cannot prove this idea, but it is intuitive as one of the basis of Technical Analysis is that it is self-fulfilling.
The RSI is calculated using a rather simple way. We first start by taking price differences of one period. This means that we have to subtract every closing price from the one before it. Then, we will calculate the smoothed average of the positive differences and divide it by the smoothed average of the negative differences. The last calculation gives us the Relative Strength which is then used in the RSI formula to be transformed into a measure between 0 and 100. This is for the momentum part. Let us proceed to the volatility part.
We sometimes measure volatility using the Average True Range. Although the ATR is considered a lagging indicator, it gives some insights as to where volatility is right now and where has it been last period (day, week, month, etc.). But before that, we should understand how the True Range is calculated (the ATR is just the average of that calculation).
The true range is simply the greatest of the three price differences:
- High — Low
- | High — Previous close |
- | Previous close — Low |
Once we have gotten the maximum out of the above three, we simply take an average of n periods of the true ranges to get the Average True Range. Generally, since in periods of panic and price depreciation we see volatility go up, the ATR will most likely trend higher during these periods, similarly in times of steady uptrends or downtrends, the ATR will tend to go lower. One should always remember that this indicator is lagging and therefore has to be used with extreme caution. Now, it is time to create the Volatility-Adjusted RSI or what we will also call the ATR-Adjusted RSI.
The idea is to divide the values of the RSI by the ATR so that we find a measure adjusted by the recent volatility. However, by doing so, we will find unbounded values, which is why we will apply the RSI formula on the values we find. Therefore, to calculate the indicator, we follow these steps:
- Calculate a 14-period RSI on the market price.
- Calculate a 14-period ATR on the market price.
- Divide the RSI by the ATR values.
- Calculate a 14-period RSI on the results from the last step.
If you want to support me and the articles I regularly publish, please consider subscribing to my DAILY Newsletter (A Free Plan is Available) via the below link. It features my Medium articles, more trading strategies, coding lessons related to research and analysis and subscribers get a free PDF copy of my book. You can expect 5–7 articles per week with your subscription. This would help me continue sharing my research. Thank you!
Coding the Volatility-Adjusted RSI in Pine Script
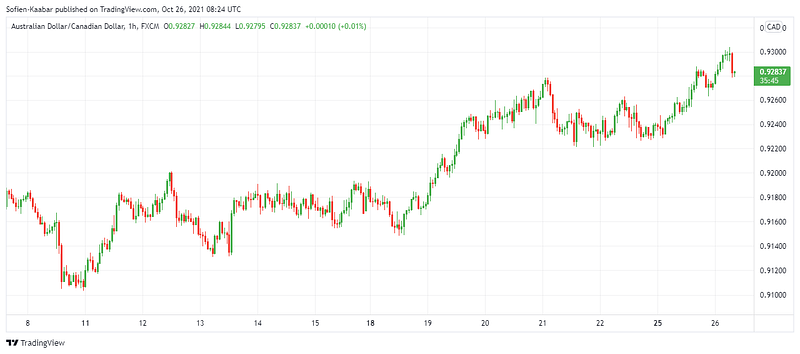
We want to create and plot the Volatility-Adjusted RSI on the AUDCAD values loaded on the TradingView platform. Note that you must create an account to be able to view the charts, the good news is that it is free. Locate the Chart button on the home screen and then choose any asset you would like to calculate the indicator on. Now, on the bottom of the screen, locate Pine Editor and warm up your fingers to do some coding.
The first step is to specify the version of Pine Script. In our case it is 5 which has some minor changes from the fourth version.
//@version = 5The next step is to specify the name of the indicator by using the following syntax. We will call it the ATR-Adjusted RSI since the ATR is the proxy of volatility here.
indicator("ATR-Adjusted RSI")Having done the introductory part, we can proceed calculating the RSI on the market price. In the fifth version of Pine Script, this is done using the ta.rsi() function as opposed to rsi() in the fourth version.
rsi = ta.rsi(close, 14)The code above creates a variable called rsi which harbors the 14-period RSI values applied on the closing prices. We can say that it is a separate array if we want to simplify things.
Now, we will calculate the Average True Range on the market price. This is done using the ta.atr() function.
atr = ta.atr(14)With the above function, you do not need to specify the source as it automatically assumes that it is applied on the market price. Let us now divide the RSI calculations by the ATR calculations to give us the first step of the indicator.
rsi_atr = rsi / atrFinally, to get the ATR-Adjusted RSI, we apply the RSI’s formula on the values of the previous step.
rsi_atr_indicator = ta.rsi(rsi_atr, 14)Let us plot the indicator. This is done using the plot() function. It takes a source and a color property as shown below. We can also use the hline() function to plot a horizontal line as a subjective barrier.
plot(rsi_atr_indicator, color = (rsi_atr_indicator > rsi_atr_indicator[1]) ? color.green : color.red)hline(70)
hline(30)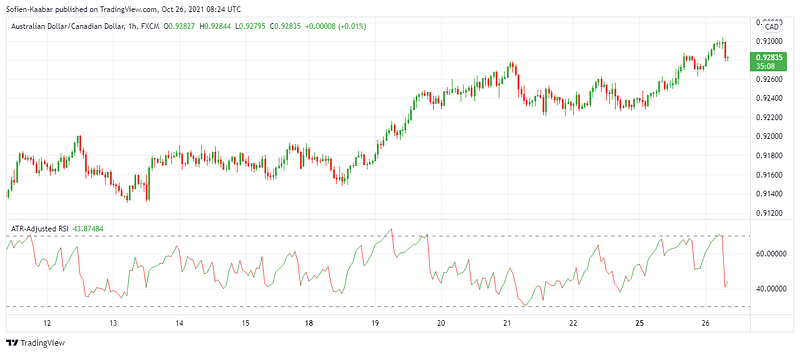
The color function used has a special technique that helps us improve our visual interpretation. It states that if the indicator moves up, draw it in green and if it moves down, draw it in red.
The full code can be found below.
//@version=5
indicator("ATR-Adjusted RSI")
rsi = ta.rsi(close, 14)
atr = ta.atr(14)rsi_atr = rsi / atrrsi_atr_indicator = ta.rsi(rsi_atr, 14)plot(rsi_atr_indicator, color = (rsi_atr_indicator > rsi_atr_indicator[1]) ? color.green : color.red)hline(70)
hline(30)If you are also interested by more technical indicators and using Python to create strategies, then my best-selling book on Technical Indicators may interest you:
Conclusion
Remember to always do your back-tests. You should always believe that other people are wrong. My indicators and style of trading may work for me but maybe not for you.
I am a firm believer of not spoon-feeding. I have learnt by doing and not by copying. You should get the idea, the function, the intuition, the conditions of the strategy, and then elaborate (an even better) one yourself so that you back-test and improve it before deciding to take it live or to eliminate it. My choice of not providing specific Back-testing results should lead the reader to explore more herself the strategy and work on it more.
Medium is a hub to many interesting reads. I read a lot of articles before I decided to start writing. Consider joining Medium using my referral link!
To sum up, are the strategies I provide realistic? Yes, but only by optimizing the environment (robust algorithm, low costs, honest broker, proper risk management, and order management). Are the strategies provided only for the sole use of trading? No, it is to stimulate brainstorming and getting more trading ideas as we are all sick of hearing about an oversold RSI as a reason to go short or a resistance being surpassed as a reason to go long. I am trying to introduce a new field called Objective Technical Analysis where we use hard data to judge our techniques rather than rely on outdated classical methods.
One Last Word
I have recently started an NFT collection that aims to support different humanitarian and medical causes. The Society of Light is a set of limited collectibles which will help make the world slightly better as each sale will see a percentage of it sent directly to the charity attributed to the avatar. As I always say, nothing better than a bullet list to outline the benefits of buying these NFT’s:
- High-potential gain: By concentrating the remaining sales proceedings on marketing and promoting The Society of Light, I am aiming to maximize their value as much as possible in the secondary market. Remember that trading in the secondary market also means that a portion of royalties will be donated to the same charity.
- Art collection and portfolio diversification: Having a collection of avatars that symbolize good deeds is truly satisfying. Investing does not need to only have selfish needs even though there is nothing wrong with investing to make money. But what about investing to make money, help others, and collect art?
- Donating to your preferred cause(s): This is a flexible way of allocating different funds to your charities.
- A free copy of my book in PDF: Any buyer of any NFT will receive a free copy of my latest book shown in the link of the article.