Coding One of the Best Trading Strategies in TradingView
Coding a Powerful Reversal Strategy on the RSI Using Pine Script

Simple strategies can be as powerful as complex strategies. This article presents one of my favorite strategies used with the RSI.
The RSI Simple Reversal Strategy
The RSI is known as the number one technical bounded indicator. With the huge number of techniques and strategies applied on it, one particular technique always arises. The pull-back technique and more specifically the simple pull-back technique awaits the confirmation of the RSI’s exit from the oversold and overbought levels before initiating a signal.
The trading conditions of the simple pull-back strategy are as follows:
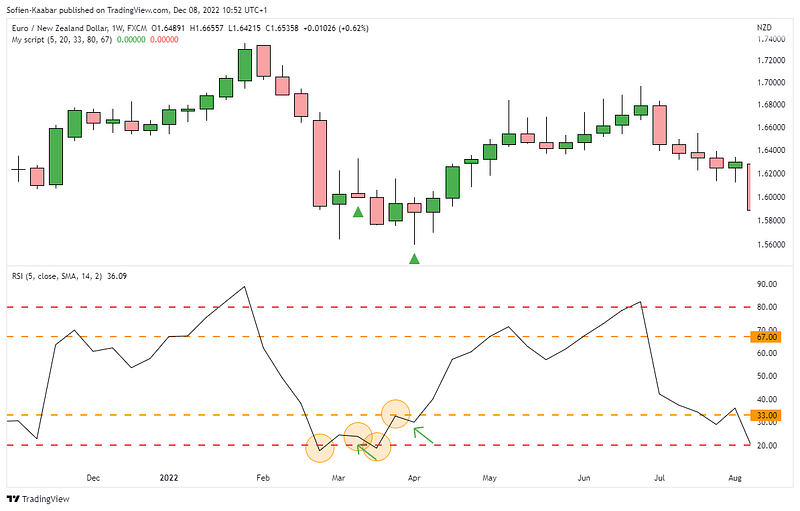
- A long (buy) signal is generated whenever the RSI surpasses the oversold level and shapes a comeback to it without surpassing a threshold level. For example, the 5-period RSI surpasses 20, does not surpass 33, and then comes back to a level between 20 and 33.
- A short (sell) signal is generated whenever the RSI breaks the overbought level and shapes a comeback to it without breaking a threshold level. For example, the 5-period RSI breaks 80, does not break 67, and then comes back to a level between 80 and 67.
The next Figure shows an example of two bullish trades generated using the strategy.
The next Figure shows an example of a bearish trade generated using the strategy.
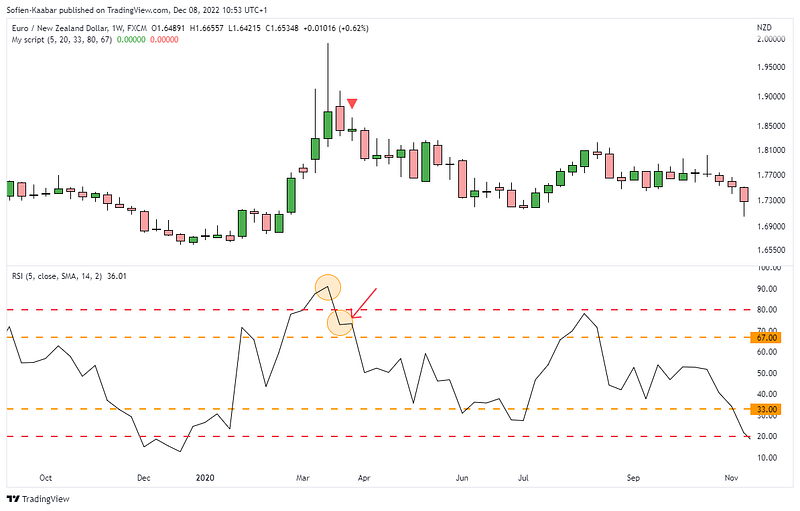
The levels in red are the overbought and oversold levels while the levels in orange are the threshold levels.
Pre-order my new book with O’Reilly Media, Deep Learning for Finance now on Amazon! In today’s fast-paced financial landscape, staying ahead of the game is essential. With the fusion of deep learning and finance, time series analysis will become second nature to you! Algorithms are covered from A-Z and range from simple linear regression to complex LSTM architectures, and even temporal convolutional neural networks! A dedicated GitHub repository is provided.
Coding the Strategy in TradingView
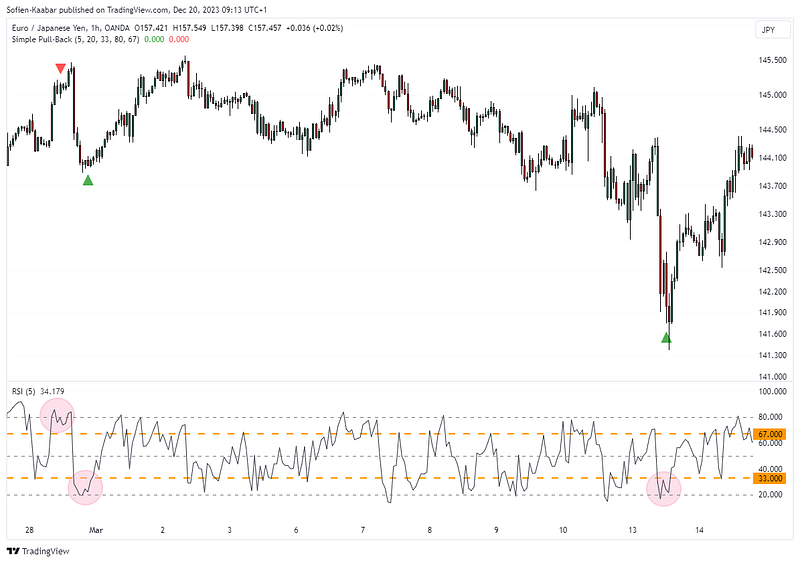
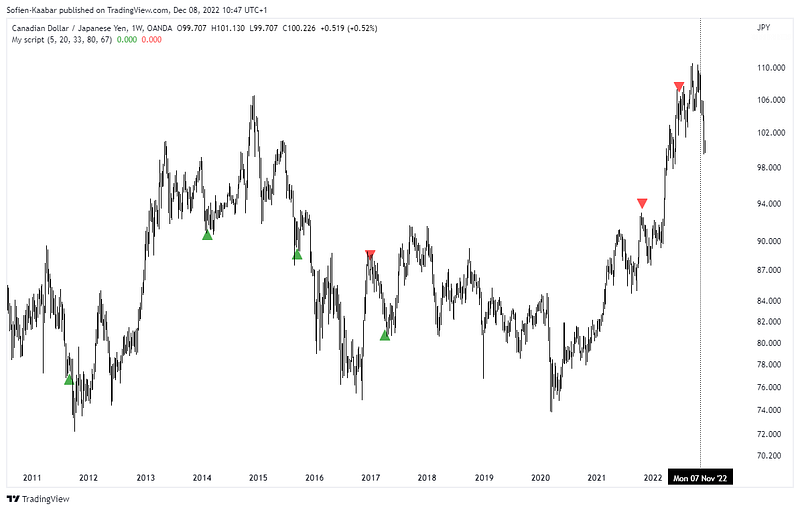
Coding the strategy in TradingView is straightforward and simple. The way we will do this is by marking the signals with green or red arrows as the following chart shows.
The code in Pine Script is as follows:
// This source code is subject to the terms of the Mozilla Public License 2.0 at https://mozilla.org/MPL/2.0/
// © Sofien-Kaabar

//@version=5
indicator("Simple Pull-Back", overlay = true)

lookback = input(defval = 5, title = 'Lookback')
lower_barrier = input(defval = 20, title = 'Lower Barrier')
lower_threshold = input(defval = 33, title = 'Lower Threshold')

upper_barrier = input(defval = 80, title = 'Upper Barrier')
upper_threshold = input(defval = 67, title = 'Upper Threshold')

rsi = ta.rsi(close, lookback)

buy_signal  = rsi >= lower_barrier and rsi < rsi[1] and rsi[1] > lower_barrier and rsi[1] < lower_threshold and rsi[2] < lower_barrier
sell_signal = rsi <= upper_barrier and rsi > rsi[1] and rsi[1] < upper_barrier and rsi[1] > upper_threshold and rsi[2] > upper_barrier

plotshape(buy_signal,   style = shape.triangleup, color   = color.green, location =  location.belowbar, size = size.small)
plotshape(sell_signal,  style = shape.triangledown, color = color.red, location   =  location.abovebar, size = size.small)
The following Figure shows another signal chart.