Code Interpreter is Taking Over the Internet: Here Are the Incredible Use Cases That Will Blow Your Mind
From analyzing a 300-hour Spotify playlist to producing jaw-dropping zoom-in videos.

Recently, I wrote a post about this awesome plugin called Code Interpreter. In case you missed it, you can check it out by clicking on this link. I went into some pretty cool detail about what exactly a Code Interpreter is and shared a bunch of different situations where it can be super useful.
To give you a quick rundown, Code Interpreter is actually a plugin for ChatGPT-4 users that makes data analysis a breeze.
Yes, you can analyze all sorts of data by simply writing prompts in plain and simple language. It’s designed to be super user-friendly, so even if you’re not a programming whiz, you can still work with it like a pro.
In my previous post, I gave some examples of how a Code Interpreter can be a game-changer. You can use it to harness the power of data and drive success in your business. Imagine creating professional-looking graphs and charts without needing any programming experience.
It’s also handy for analyzing stocks and cryptocurrencies, and even turning your data into cool heat maps. Plus, government agencies can totally benefit from Code Interpreter too, whether it’s optimizing taxes, boosting income, improving facilities, or even reducing crime.
But here’s the thing: the more I explore and experiment with Code Interpreter, the more awesome use cases I discover. And that’s why I’m writing this new post!
So, without further ado, let’s dive into these fantastic use cases that’ll blow your mind!
1. No Info Provided, Just an Excel File — What Happened Next Will Shock You!
I came across a fascinating thread on Twitter shared by a user named Peter Yang.
The post caught my attention as it revolved around an intriguing Excel file upload. However, what piqued my curiosity, even more, was the fact that Peter didn’t provide any accompanying information, leaving the file to speak for itself.
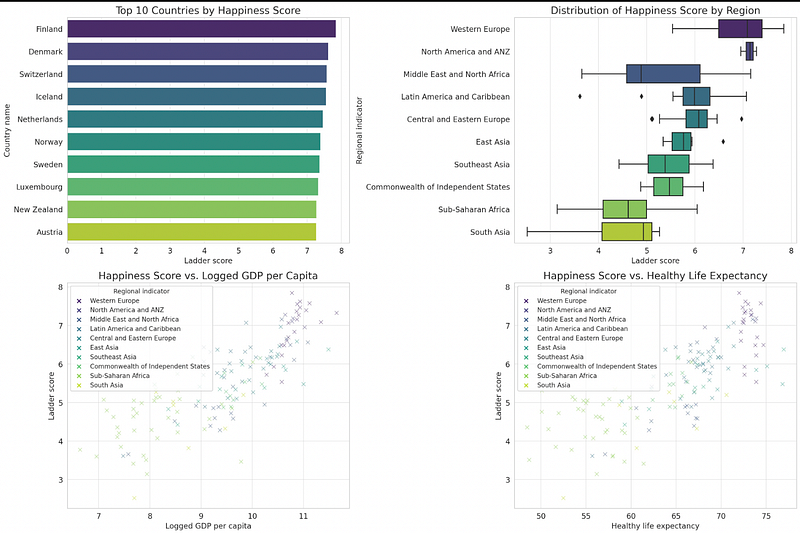
Code Interpreter found out that the Excel file was essentially a World Happiness Report for the year 2021.
Quite intriguing, isn’t it?
But here’s the truly astonishing part: in a matter of mere minutes, the file generated a plethora of insightful charts. This revelation made me realize the immense power and potential held within data analysis.
With access to the right data, anyone, regardless of their background, can now predict business strategies, identify successful products, and make informed decisions.
2. Twitter User Discovers Mind-Blowing Data Analysis Hack for Spotify Playlists
Another user on Twitter shared an interesting thread that had me completely hooked.
In the thread, the user decided to delve into the fascinating world of data analysis by employing the ChatGPT Code Interpreter to analyze an enormous 300-hour Spotify favorite playlist.
Now, brace yourself for the mind-blowing part — the resulting graph that was generated is simply awe-inspiring!
Imagine the possibilities that lie within this revelation.
With just a few clicks, anyone can effortlessly generate and analyze massive amounts of data, unlocking invaluable insights that can shape strategies and lead to success. It’s like having a secret weapon in your hands, enabling you to gain an edge in any field.
3. From Mesmerizing GIF to Jaw-Dropping Zoom-In Video!
I’ve got something super cool to share with you!
Riley Goodside recently posted this fascinating thread on Twitter that’s been buzzing with excitement.
What did he do, you ask? Well, Riley uploaded a mesmerizing GIF and threw a challenge at the incredible Code Interpreter. The challenge? To work its magic and generate a 5-second MP4 video with a jaw-dropping, dramatic slow zoom-in effect.
Can you imagine that?

On the left side, there is GIF that Riley uploaded and on the right side, there is a 5-second MP4 video with a slow zoom-in effect.
Believe it or not, the zoom-in effect was so dramatic, it truly took the visual experience to a whole new level. Riley’s experiment perfectly showcased the incredible capabilities of Code Interpreter and its ability to transform a simple GIF into a captivating video masterpiece.
Here is the link, if you want to read more.
4. Visuals to Text in Seconds
Let’s dive into the fascinating world of Multimodal AI.
In simple terms, Multimodal AI refers to the ability of an AI system to comprehend inputs from various modes or modalities, such as text, speech, images, and videos.
And guess what? The incredible capabilities of Multimodal AI are now at your fingertips, thanks to the Code Interpreter plugin.
To illustrate this, Shubham shared an interesting thread on Twitter where he uploaded an invoice image and simply requested GPT-4 to generate a text file based on the visual information provided.
The outcomes, as it turned out, were amazing. GPT-4, driven by the power of the Code Interpreter plugin, swiftly processed the invoice image and generated a text file that accurately captured the details within the image.
This cool thing where visual data turns into text showed just how amazing Multimodal AI has gotten. It’s seriously impressive how it can make data analysis so much easier and smoother.
5. Ethan Mollick’s Twitter Breaks the Internet with a Stunning 3D Music Visualization!
Now let’s take a cool example related to music,
Ethan Mollick on Twitter has shared an interesting Twitter thread. More specifically, he took the entire Billboard Hot 100 and uploaded it into the system.
Here is the command he wrote: Can you create an interactive 3D visualization that showcases the ultimate ‘Song of the Summer’?
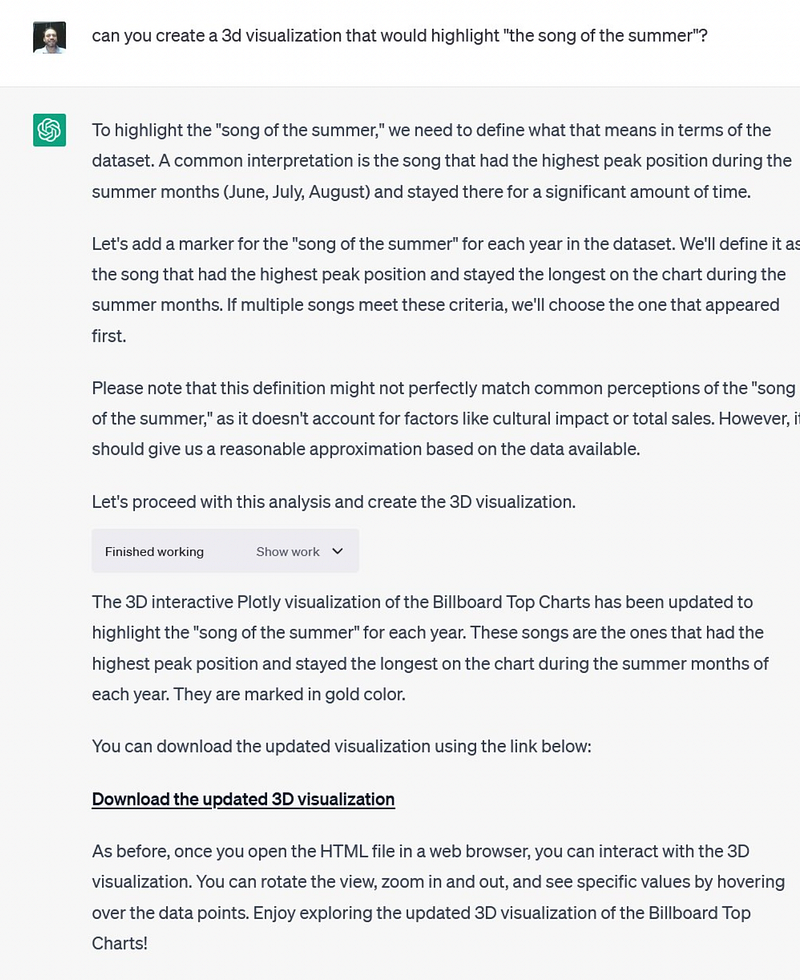
And based on the command and the data, Code Interpreter has generated an unbelievable output.
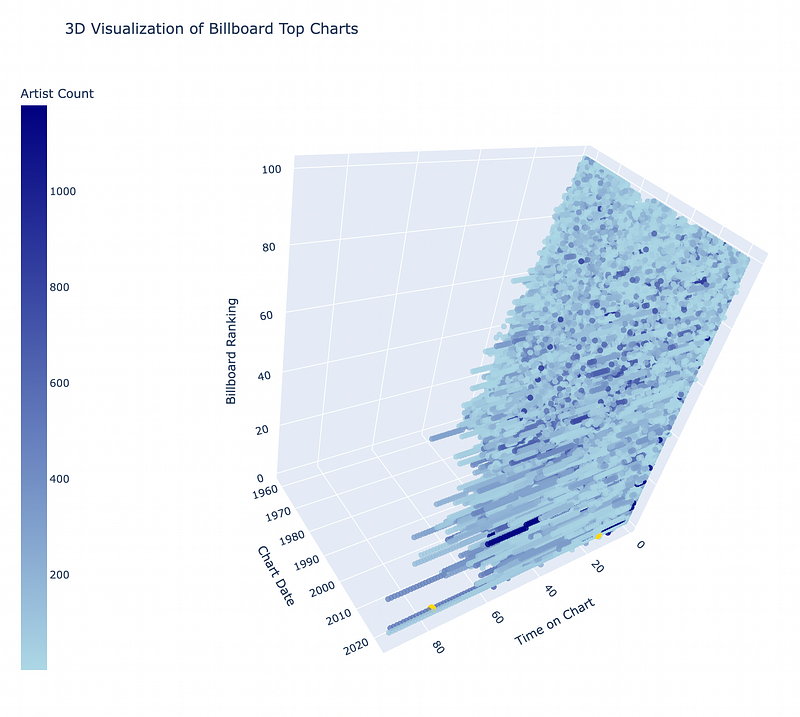
Here is the output if you want to give it a try.
Hope you like it.
That’s it — thanks.
Consider becoming a Medium member if you appreciate reading stories like this and want to help me as a writer. It costs $5 per month and gives you unlimited access to Medium content. I’ll get a little commission if you sign up via my link.