
CNN Approach: Using Image of the Polymer to Predict its Glass Transition Temperature
In this article, we will be using the image of the polymer structure to predict its glass transition temperature. This article follows a similar methodology as published in one of the recent research papers by Luis.A. Miccio from Materials Physics Center and Donostia International Physics Center in Spain.
Introduction:
Glass Transition temperature is one of the crucial properties of polymers. It marks the temperature range below which the atoms of a supercooled liquid are temporarily frozen (without crystallizing) upon cooling. Predicting glass transition temperature (Tg) provides valuable insights into polymer properties whose synthesis may otherwise be costly and time-consuming. Scientists have always been more keener to develop machine learning models qualitatively(For instance, using several other properties to predict its tensile strength). During the last few years, the major emphasis has been given to Quantitative Structure-Property Relationships. This opens the possibility of predicting various properties with just the Structure of the molecular (i.e just the image) compound avoiding requirement of any additional experimental properties or tedious calculations. In this article, we will be using Convolutional Neural Networks to predict Tg of unknow polymer compounds, using the image of the polymer. This sounds so cool, this literally means that if you just draw the image of the monomeric unit on a whiteboard that would be enough to predict its Tg. We do not need any other external information or properties for the polymer.
Importing Relevant Packages
Dataset
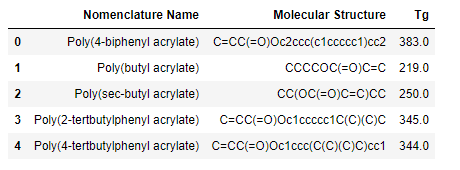
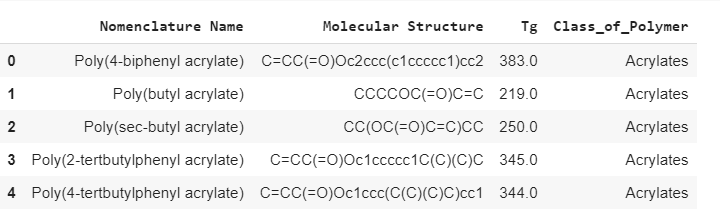
The dataset used in our study was gathered from a popular polymer database. The dataset for this study comprises of 351 polymers along with their smiles codes, molecular names as input attributes and glass transition temperatures as the output variable. Subsets of 300 polymers and their Tg values were used for training validating the dataset, whereas the rest 51 unseen polymers were used to test the results for both the models, the CNN and the proposed ANN. The figure below shows the top 5 rows of the dataset. The dataset for this study can be found here.
Classifying Polymers
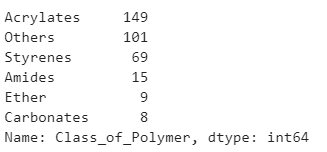
The dataset was manually explored using the Pandas library in python and was classified into eight different classes of polymers- acrylates, styrenes, amides, alkenes, ether, amides, carbonates, and others.
Exploratory Data Analysis
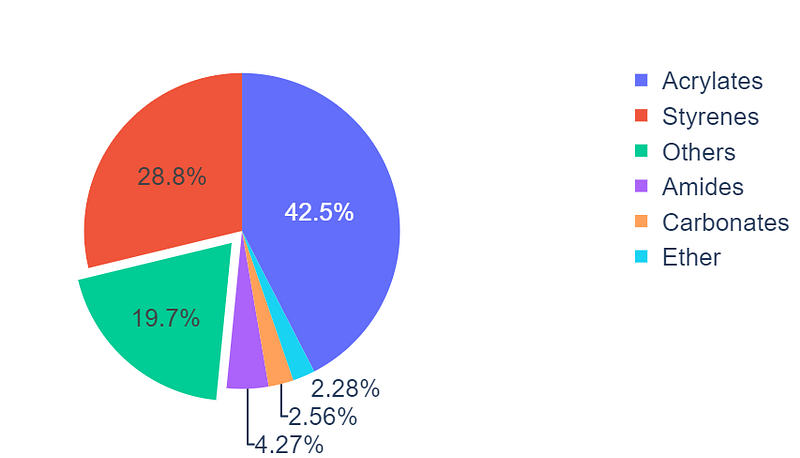
Pie Plot: The pie plot in Figure shows the exact composition of the dataset, with acrylates and styrenes being the highest contributors
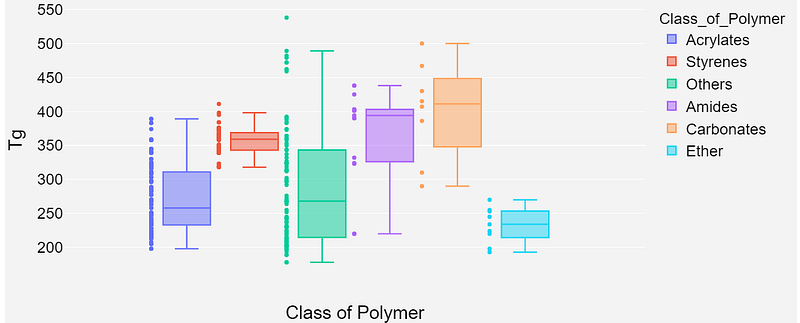
Box Plot: The box plot is used to show the scatter plot of the underlying Tg distributions for each class of polymers. It can be seen that styrenes tend to have higher Tg whereas acrylates have a fairly mixed distribution.
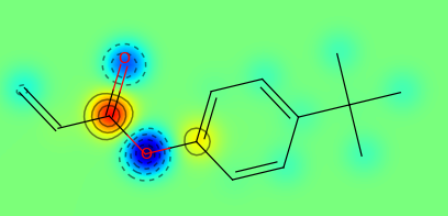
Distribution of Charge in Monomer
The open-source RDKit [1] python package was used to visualize the molecular structure of polymers from the dataset into drawings. One such function in RDKit[1] module employed to compute the Gasteiger partial charges for monomeric units.
Feature Engineering
Engineering features have been vital in preparing the data for modeling and presenting attributes in machine-readable form. As per the problem statement, the Tg prediction was to be based on images of the polymer chemical structure fed into the CNN architecture in encoded form using SMILES line notations. The main aim of feature engineering for this problem is to incorporate the chemical structure as well as the chemical composition of the monomeric unit to predict Tg. This is achieved using the SMILES line notations [2].
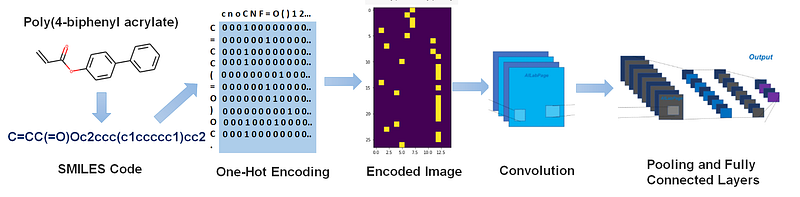
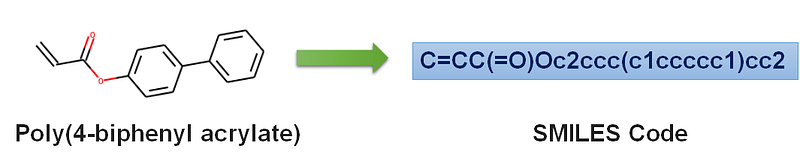
Introduction to SMILES Notation: SMILES stands for Simplified molecular-input line-entry system. This is basically a way of describing the chemical structure in the form of a line notation using different characters. The image below shows the SMILES notation for the given chemical structure.
Molecular Structure to Image Encoding: We first defined a list containing all the unique characters that can be present in any given SMILES linear string for a polymer.

Further, as the second step, the linear string of polymers in the form of line notation are 1-hot encoded in machine-readable form through binary images by using this list of unique SMILES characters. The resulting transformation is an n-dimensional matrix consisting of binary images that can be fed into the CNN architecture. Each binary image is a matrix of the dimensions m × n, where n represents the number of characters in the unique SMILES list and m is the number of characters present in polymer with the longest smiles code. The figure given below depicts the encoding process visually for 1 polymer example -Poly(4-biphenyl acrylate).
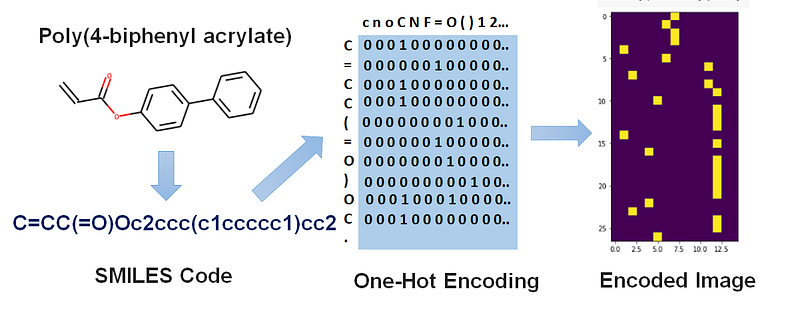
The generated one hot encoded image takes into account the chemical structure and the composition of the monomeric unit. We can see that the encoded image tells us the number of each kind of atoms present in the monomeric structure in a binary form along with the alignment structure of atoms in the polymeric chain relative to each other.
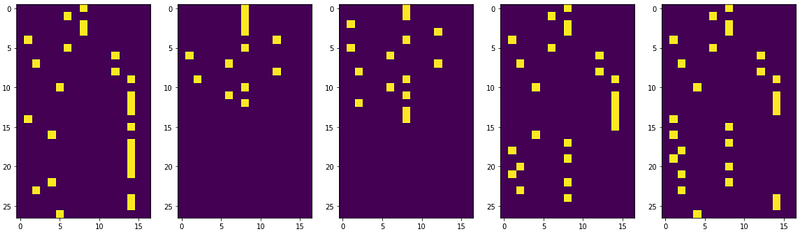
The figure given below generates the encoded image of the top five polymers in the data frame.
Model Implementation
The image encoded molecular structure was fed as an input to the CNNs and the target variable was Tg of the given polymers, which is a continuous variable. This model was implemented using the Keras library which serves as an Application Programming Interface (API) for Tensorflow.
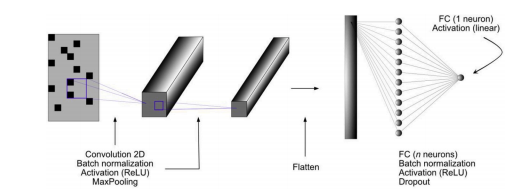
Proposed Architecture: The choice of the final hyper-parameters has been made by incorporating various combinations of all the different hyper-parameters. The best-observed configuration uses filter size of 64 with a window size of (5,5) in the first layer and size (3,3) with 32 filters in the second layer. This is followed by a max-pooling layer with a window size of (3,3). Post the max-pooling layer, we have three dense layers with 32, 10, and 1 neurons respectively, with the final dense layer being the output of our proposed ANN model. ReLu activation function was used by all layers with l2 regularization. The model achieved its best generalization by training up to 180 epochs with a batch size of 64 and a learning rate of 0.03. A validation split of 0.1 and drop out probability of 0.1 was used in training the network to perform cross-validation.
Results
The figures given below show the experimental and the predicted values of the glass transition temperatures for the training and the unseen test sets. For an ideal model, we would expect the real values to be perfectly equal to the predicted Tg values. This will result in a straight line passing throw the origin.
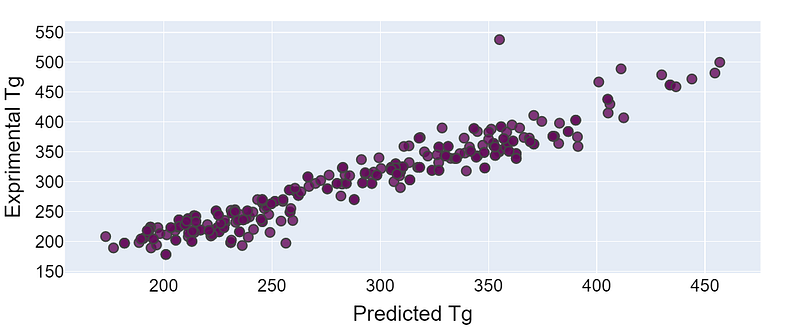
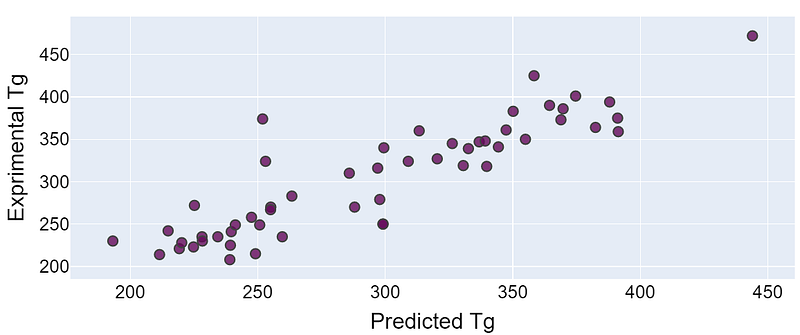
It can be perceived that most of the examples show very accurate prediction when compared to the real Tg values. However, there are a few polymers contributing to a significant level of uncertainty in prediction due to their lack of sufficient training data. These polymers belong to the minority classes of esters and ethers and due to insufficient training for either, the Tg of these polymers is not being learned effectively.
Loss Metrics: We used the mean absolute loss function while training the neural networks. But for our final evaluation, we have used mean relative % error as the evaluation metrics for our model. This can be represented as follows-
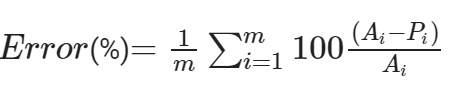
where Ai is the actual Tg value and Pi is the predicted Tg value. The average of this relative % error was taken over the full dataset of m polymers. Post the training process we computed the respective training and testing mean relative errors.


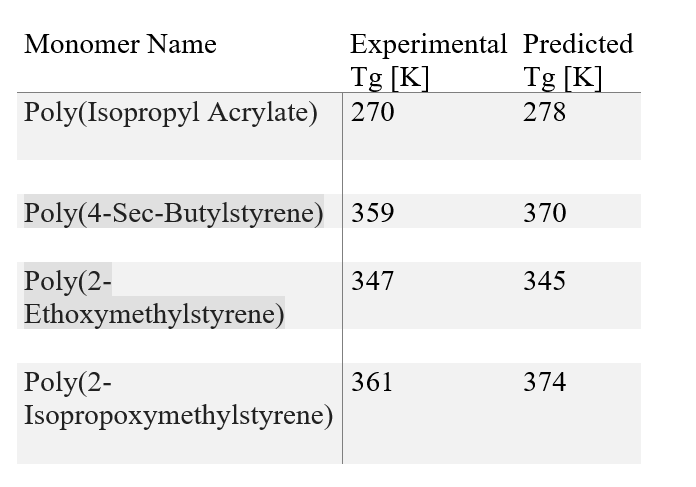
The table given below shows the real and predicted Tg values for 4 unseen polymers. We can see that our predictions lie very close to the experimental Tg values signifying that the proposed model shows an excellent generalization ability.
Conclusions
In this study, we demonstrated the feasibility of CNN to predict the Tg of the polymer by taking into account the molecular structure and chemical composition of the monomeric units in the polymer. We were able to achieve a relative error of 6% and 7% training and test set respectively. In my next article, I will be using fully connected neural networks to predict the glass transition temperature. This new model will incorporate all kinds of intra-molecular interactions along with the chemical composition and molecular structure to predict Tg.
Credits
Special Thanks to Danish for contributing to this project.
References:
1-G. Landrum et al., “Rdkit: cheminformatics and machine learning software,” RDKIT. ORG, 2013.
2-Luis A. Miccio, Gustavo A. Schwartz, “From chemical structure to quantitative polymer properties prediction through convolutional neural networks”, Polymer, 2018
Thank you for reading!!!!
If you like my work and want to support me:
1-The BEST way to support me is by following me on Medium.
2-Follow me on LinkedIn.


