
Classification vs. Regression in Machine Learning — Which One Should I Use?
Overview
Model selection in Machine Learning exercises is one of the foundational questions that we will need to find an answer for as a Data Scientist. In this post we continue our journey of learning about Data Science Role Requirements by learning more about model selection and specifically the differences between a regression and classification model.
We will first go over an introduction of each of the regression and classification models and then will do a comparison between the two.
Let’s get started!
1. Regression Models
Regression models are used to predict a continuous output (or dependent) variable from input (or independent) variables. Some examples of such continuous output variables are quantities such as height, weight, salary, probability, etc.
Now that we understand what a regression model is, let’s look at some of the most common regression models:
1.1. Simple Linear Regression
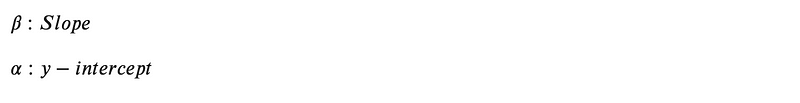
This is when one independent variable (x) is used to predict a dependent variable (y). Equation of a line is one such example:

1.2. Multiple (or Multivariable) Linear Regression
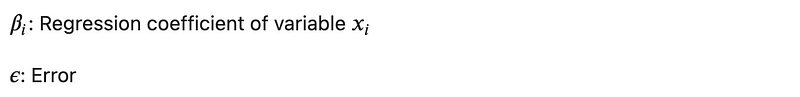
A more generalized linear regression where more than one independent variables are used to predict a dependent variable, such as:

1.3. Polynomial Regression
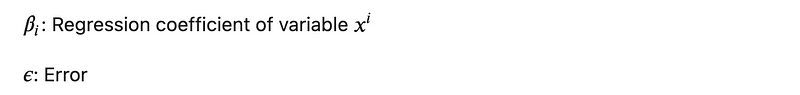
A regression describing a non-linear relationship between dependent and independent variables, such as:

2. Classification Models
Classification models are used to predict a discrete output (or dependent) variable from input (or independent) variables (unlike regression models that predict a continuous dependent variable). We can think of each of the discrete values of the dependent variable as “classes” and hence the naming of these models. One example is the machine learning algorithm that decides whether an email is spam or not.
Now that we understand what a classification model is, let’s look at some of the most common classification models:
2.1. Logistic Regression
Logistic Regression, despite its name, is a classification algorithm where the dependent variable can only take two classes (e.g. yes vs. no or 0 vs. 1). Classification problems with only two possible outcomes for the dependent variables are called binary classifications.
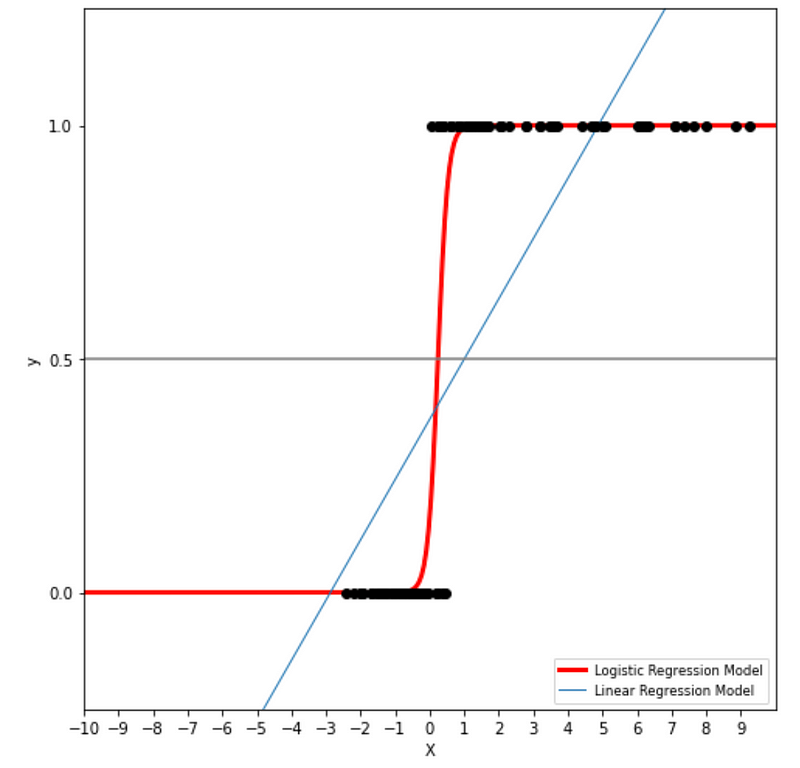
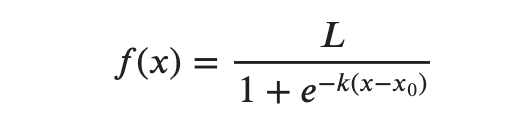
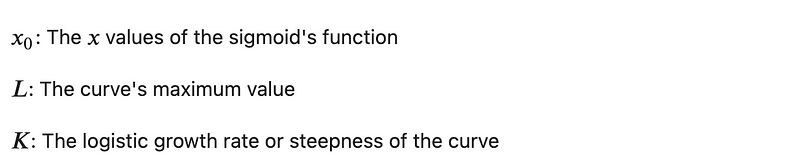
Logistic regression relies on the logistic function, which is a sigmoid curve with the following equation:
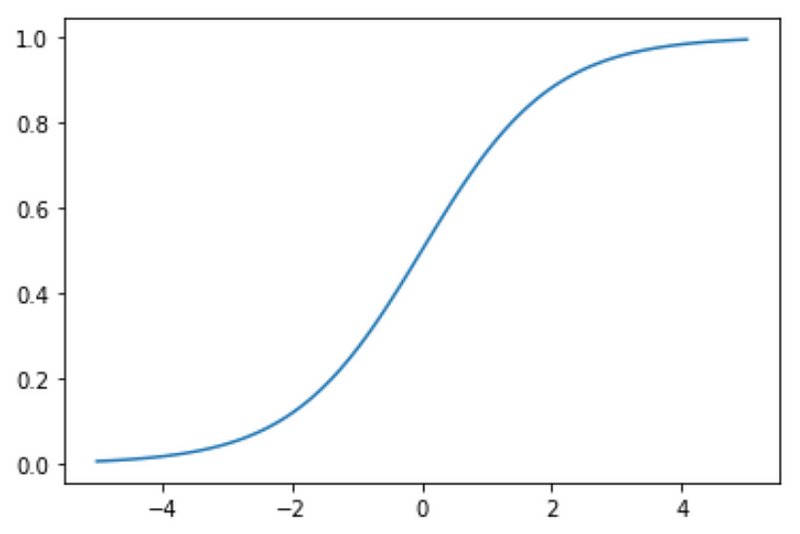
With some simplifying assumptions, logistic regression plot is as follows:
Assumtions:

A logistic regression model calculates the probability based on the formula above, which will always end up between 0 and 1. Then when the probability is between 0 and 0.5, assigns it to one class, such as 0 or not-spam and then when the probability is between 0.5 and 1, assigns it to the other outcome, such as 1 or spam.
2.2. Naive Bayes
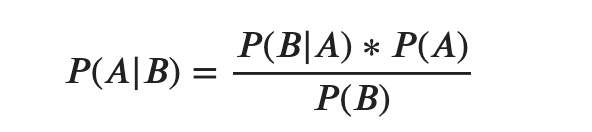
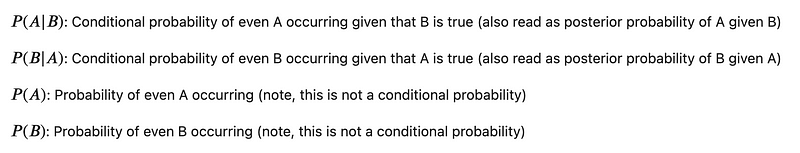
Naive Bayes calculates the probability of a data point belonging to a certain class. It is called Naive because it assumes the occurrence of a certain feature is independent of the occurrence of other features. And it is called Bayes since it relies on Bayes’ Theorem, described below. For the purposes of this post, you can just remember that Naive Bayes is a type of classification model.
3. Regression vs. Classification
Most important difference between regression and classification models is that the former is used to predict continuous outcomes, while the latter is used to predict discrete outcomes.
Pro Tip: It is important to keep in mind that sometimes the goal is not to just pick one of the regression or classification models and rather to understand what purpose each one serves and then take advantage of the differences between regression and classification models. In many machine learning pipelines, we end up using both. For example, if I call a customer service number, they may first use a classification model (based on my location, time of the day, etc.) to route my incoming call to a specific queue and then use a separate regression model to predict the wait time and inform me accordingly. In other words, the pipeline took advantage of the strengths of both approaches — the outcome of the classification model was used as an upstream input to the regression model to improve the overall performance of the pipeline, which was predicting the customer wait time.
Notebook
I used a notebook to create some of the formula and plots in this post. In case you are curious to see how this is done, I’ve included it below for reference.
Thanks for Reading!
If you found this post helpful, please follow me on Medium and subscribe to receive my latest posts!


