
Choosing the Right Metric for Evaluating Machine Learning Models — Part 2
Second part of the series focussing on classification metrics

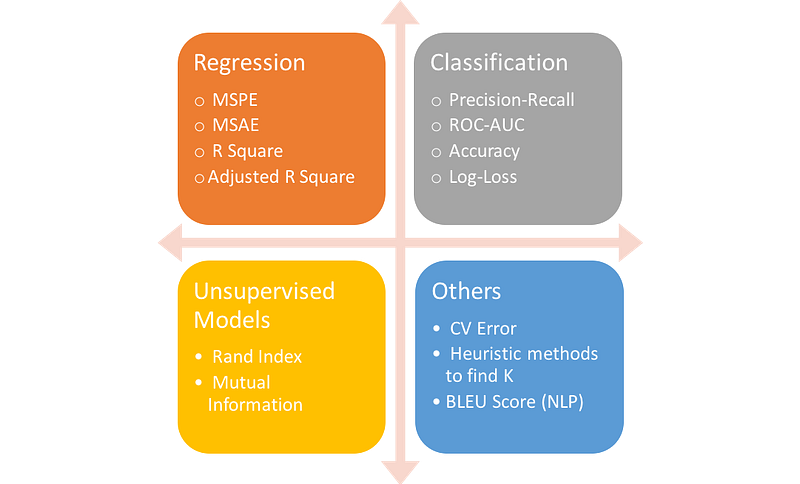
In the first blog, we discussed some important metrics used in regression, their pros and cons, and use cases. This part will focus on commonly used metrics in classification, why should we prefer some over others with context.
Definitions
Let’s first understand the basic terminology used in classification problems before going through the pros and cons of each method. You can skip this section if you are already familiar with the terminology.
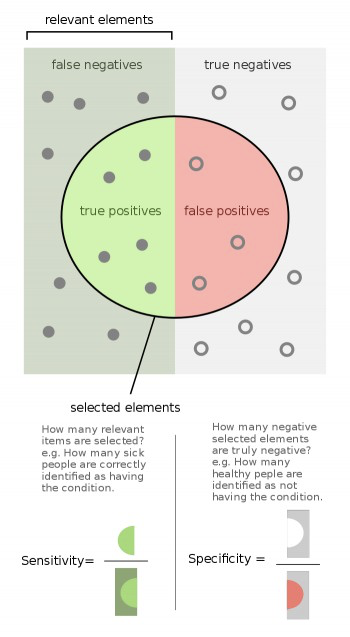
- Recall or Sensitivity or TPR (True Positive Rate): Number of items correctly identified as positive out of total true positives- TP/(TP+FN)
- Specificity or TNR (True Negative Rate): Number of items correctly identified as negative out of total negatives- TN/(TN+FP)
- Precision: Number of items correctly identified as positive out of total items identified as positive- TP/(TP+FP)
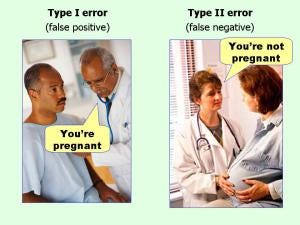
- False Positive Rate or Type I Error: Number of items wrongly identified as positive out of total true negatives- FP/(FP+TN)
- False Negative Rate or Type II Error: Number of items wrongly identified as negative out of total true positives- FN/(FN+TP)
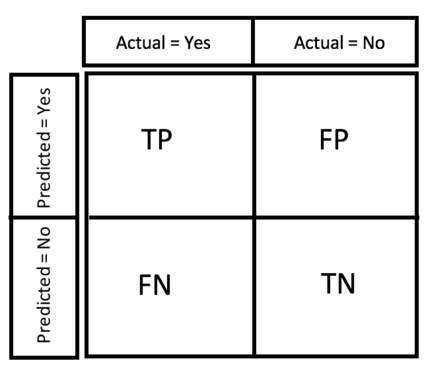
- Confusion Matrix
- F1 Score: It is a harmonic mean of precision and recall given by- F1 = 2*Precision*Recall/(Precision + Recall)
- Accuracy: Percentage of total items classified correctly- (TP+TN)/(N+P)
ROC-AUC Score
The probabilistic interpretation of ROC-AUC score is that if you randomly choose a positive case and a negative case, the probability that the positive case outranks the negative case according to the classifier is given by the AUC. Here, rank is determined according to order by predicted values.
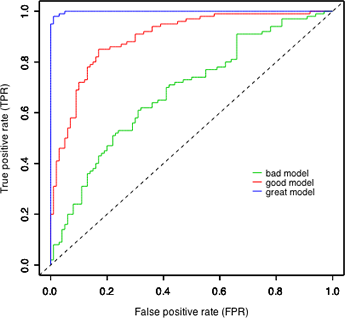
Mathematically, it is calculated by area under curve of sensitivity (TPR) vs. FPR(1-specificity). Ideally, we would like to have high sensitivity & high specificity, but in real-world scenarios, there is always a tradeoff between sensitivity & specificity.
Some important characteristics of ROC-AUC are-
- The value can range from 0 to 1. However auc score of a random classifier for balanced data is 0.5
- ROC-AUC score is independent of the threshold set for classification because it only considers the rank of each prediction and not its absolute value. The same is not true for F1 score which needs a threshold value in case of probabilities output
Log-Loss
Log-loss is a measurement of accuracy that incorporates the idea of probabilistic confidence given by following expression for binary class:

It takes into account the uncertainty of your prediction based on how much it varies from the actual label. In the worst case, let’s say you predicted 0.5 for all the observations. So log-loss will become -log(0.5) = 0.69. Hence, we can say that anything above 0.6 is a very poor model considering the actual probabilities.
Case 1
Comparison of Log-loss with ROC & F1
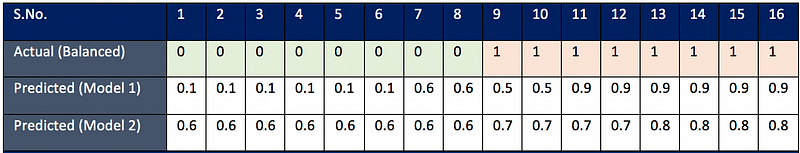
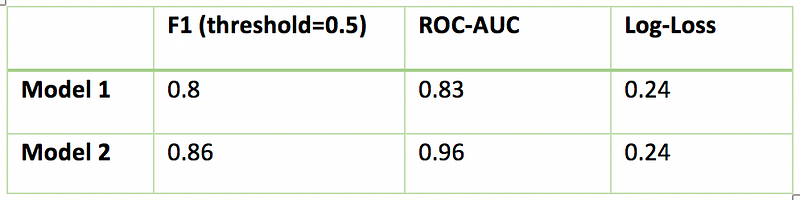
Consider Case 1 (Balanced Data), it looks like model 1 is doing a better job in predicting the absolute probabilities whereas model 2 is working best in ranking observations according to their true labels. Let’s verify with the actual score:
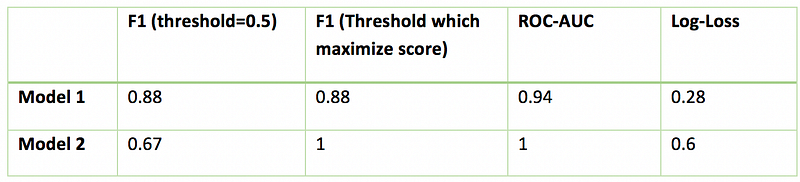
If you consider log-loss, Model 2 is worst giving a high value of log-loss because the absolute probabilities have big difference from actual labels. But this is in complete disagreement with F1 & AUC score, according to which Model 2 has 100% accuracy. Also, you would like to note that with different thresholds, F1 score is changing, and preferring model 1 over model 2 for default threshold of 0.5.
Inferences drawn from the above example (balanced): - If you care for absolute probabilistic difference, go with log-loss - If you care only for the final class prediction and you don’t want to tune threshold, go with AUC score -F1 score is sensitive to threshold and you would want to tune it first before comparing the models
Case 2
How each of them deals with class imbalance?
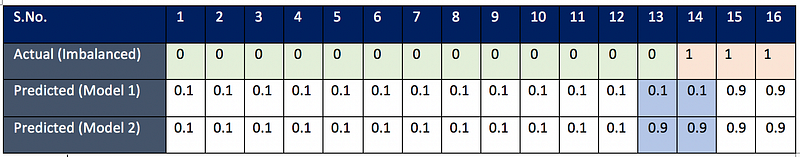
The only difference in the two models is their prediction for observation 13 & 14. Model 1 is doing a better job in classifying observation 13 (label 0) whereas Model 2 is doing better in classifying observation 14 (label 1). The goal is to see which model actually captures the difference in classifying the imbalanced class better (class with few observations, here it is label 1). In problems like fraud detection/spam mail detection, where positive labels are few, we would like our model to predict positive classes correctly and hence we will sometime prefer those model who are able to classify these positive labels
Clearly log-loss is failing in this case because according to log-loss both the models are performing equally. This is because log-loss function is symmetric and does not differentiate between classes .
Both F1 score and ROC-AUC score is doing better in preferring model 2 over model 1. So we can use both these methods for class imbalance. But we will have to dig further to see how differently they treat class imbalance.
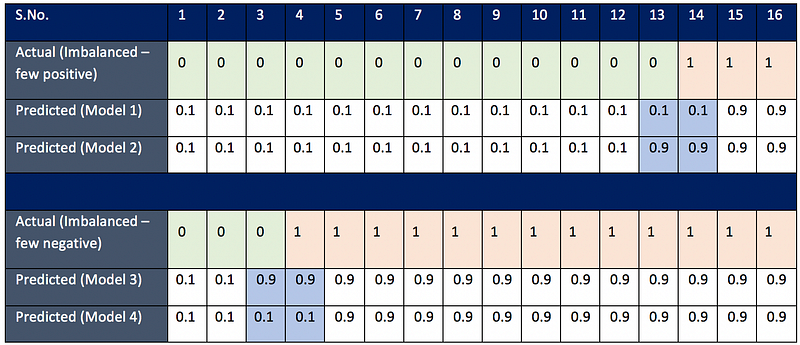
In the previous example, we saw that there were few positive labels. In the second example, there were few negative labels. Let’s see how F1 score & ROC-AUC differentiate between these two cases.
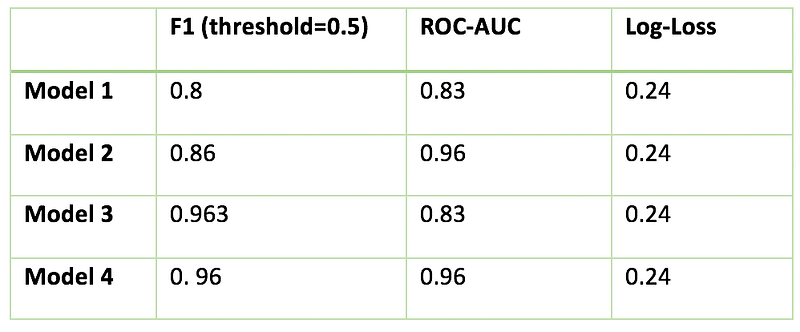
ROC-AUC score handled the case of few negative labels in the same way as it handled the case of few positive labels. An interesting thing to note here is that F1 score is pretty much same for both Model 3 & Model 4 because positive labels are large in number and it cares only for the misclassification of positive labels.
Inferences drawn from above example: - If you care for a class which is smaller in number independent of the fact whether it is positive or negative, go for ROC-AUC score.
When will you prefer F1 over ROC-AUC?
When you have a small positive class, then F1 score makes more sense. This is the common problem in fraud detection where positive labels are few. We can understand this statement with the following example.
We can see that model (1) predicts 5 positives out of 100 true positives in a dataset of size 10K observations, while another model (2) predicts 90 positives out of 100 true positives. Clearly, model (2) is doing a much better job than model (1) in this case. Let’s see if both F1 score & ROC-AUC score are able to capture that difference
F1 score for model (1) = 2*(1)*(0.1)/1.1 = 0.095
F1 score for model (2) = 2*(1)*(0.9)/1.9 = 0.947
Yes, the difference in F1 score reflects the model performance.
ROC-AUC for model (1) = 0.5
ROC-AUC for model (2) = 0.93
ROC-AUC gives a decent score to model 1 as well which is nota good indicator of its performance. Hence we should be careful while picking roc-auc for imbalanced datasets.
Which metric should you use for multi-classification?
We have further three types of non-binary classification:
- Multi-Class: classification task with more than two classes such that the input is to be classified into one, and only one of these classes. Example: classify a set of images of fruits into any one of these categories — apples, bananas, and oranges.
- Multi-labels: classifying a sample into a set of target labels. Example: tagging a blog into one or more topics like technology, religion, politics etc. Labels are isolated and their relations are not considered important.
- Hierarchical: each category can be grouped together with similar categories, creating meta-classes, which in turn can be grouped again until we reach the root level (set containing all data). Examples include text classification & species classification. For more details, refer this blog.
In this blog, we will cover only the first category.
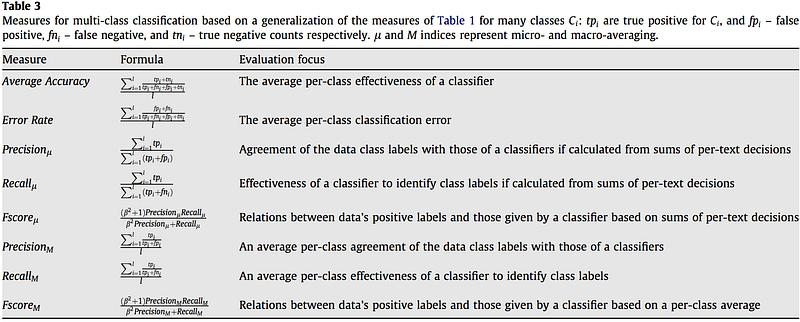
As you can see in the above table, we have broadly two types of metrics- micro-average & macro-average, we will discuss the pros and cons of each. Most commonly used metrics for multi-classes are F1 score, Average Accuracy, Log-loss. There is yet no well-developed ROC-AUC score for multi-class.
Log-loss for multi-class is defined as:
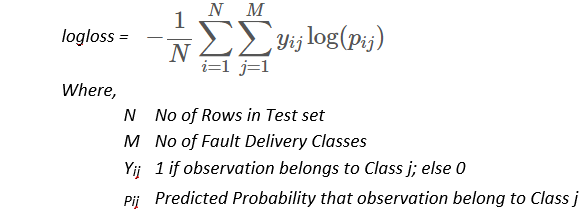
- In Micro-average method, you sum up the individual true positives, false positives, and false negatives of the system for different sets and then apply them to get the statistics. - In Macro-average, you take the average of the precision and recall of the system on different sets
Micro-average is preferable if there is a class imbalance problem.
In the third part, I will be focussing on metrics used in unsupervised learning problems where it is even harder to quantify the correctness of a model without the presence of target variables. Stay tuned! In the meantime, check out my other blogs here!
About Me: Masters Candidate in Data Science at USF. Interested in working with cross-functional groups to derive insights from data, and apply Machine Learning knowledge to solve complicated data science problems. LinkedIn: www.linkedin.com/in/alvira-swalin
References
- https://classeval.wordpress.com/simulation-analysis/roc-and-precision-recall-with-imbalanced-datasets/
- https://en.wikipedia.org/wiki/Precision_and_recall
- https://www.sciencedirect.com/science/article/pii/S0306457309000259
- https://stats.stackexchange.com/questions/11859/what-is-the-difference-between-multiclass-and-multilabel-problem
- https://datascience.stackexchange.com/questions/15989/micro-average-vs-macro-average-performance-in-a-multiclass-classification-settin/16001


