
Chandelier Exit + ZLSMA, the best day trading tool ever?
Today, I’ll be looking at a combination of two TA indicators, and see whether using these two to day trade could make you a lot of profit
My inspiration for this article came through the Youtube algorithm, which presented me this video. While I’m usually not a big believer in day trading, I had become curious to find out whether this so called best indicator could be profitable on a regular basis.
I’ll be explaining the basics to understand how the strategy works and then test it myself to find out whether this is actually something worth using.
How does it work?
Our strategy consists of two indicators, a public Indicator called the Chandelier Exit, which was created by a user named everget.
And then secondly a Zero Lag Simple Moving Average (ZLSMA) by veryfid.
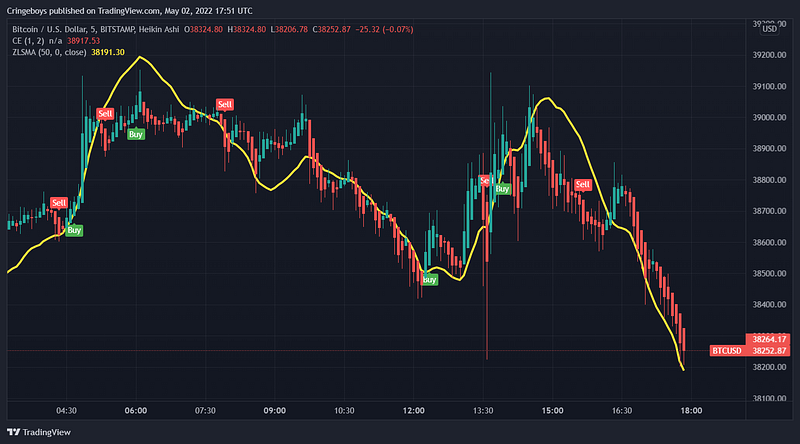
We won’t be using regular candles here, but rather Heikin Ashi candles.
(Theses scripts can be used for free on Tradingview.com)
Chandelier exit Settings
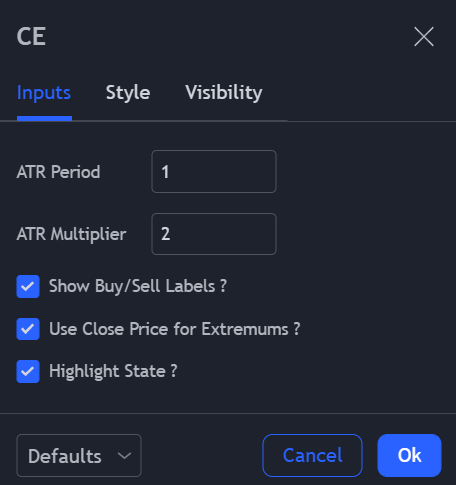
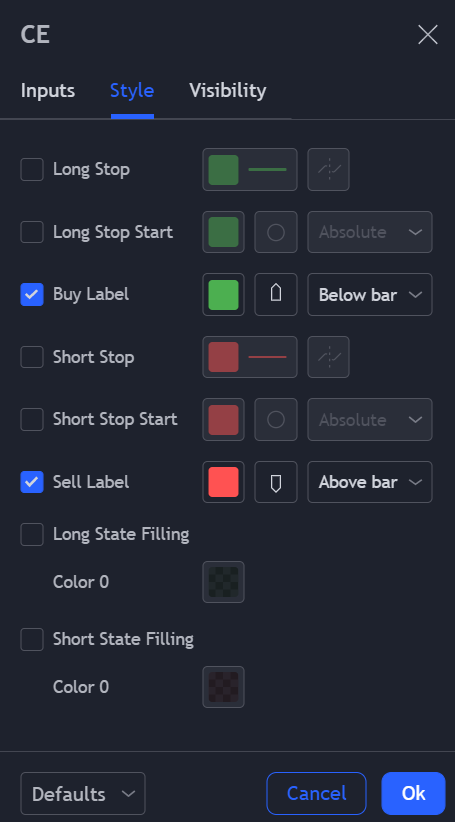
These settings were recommended in the video and they indeed are a great addition to these tools, the new Input settings help in getting into the right trades earlier, while the style settings help to still be able to see everything clearly (especially once we add the ZLSMA)
ZLSMA Settings
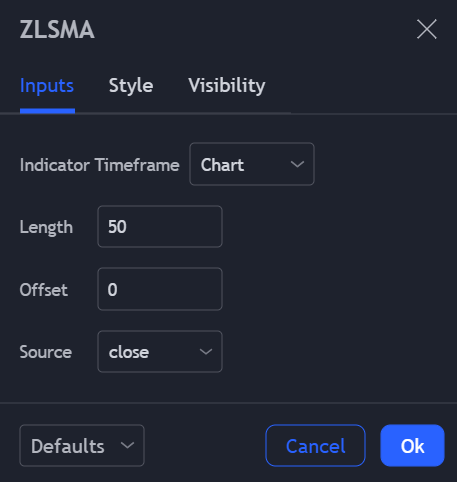
We’ll simply be upping the Length from 32 to 50 here.
How do you use it?
In this part, we’ll be providing a simple and clear checklist (with examples) for when to enter and exit the trades. This indicator combination works for both going Long as for going Short.
Entering a Long position
- Buy signal
- Candle is above ZLSMA (yellow line)
Exiting a Long position
- Candle closes below ZLSMA
Here it’s very important to note that the candle must close below the ZLSMA, before you can exit the trade
Here’s an example of how you would go long using this indicator.
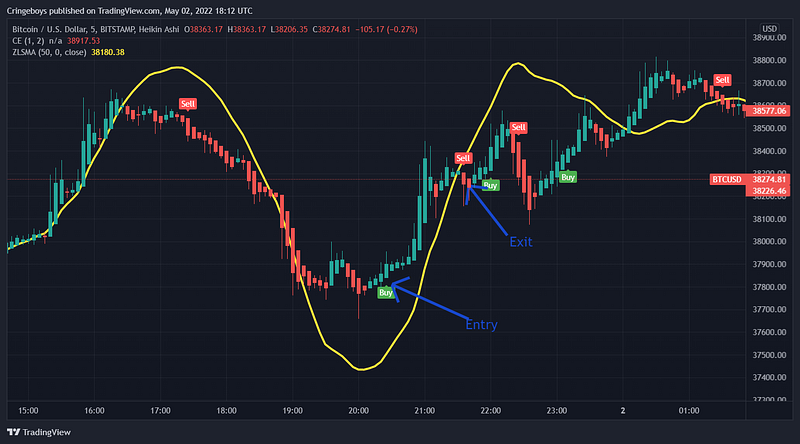
This woud have also gained us 1.1% profit.
Entering a short position
- Sell indicator
- Candle below ZLSMA
Exiting a short position
- Candle closes above ZLSMA
Short Example
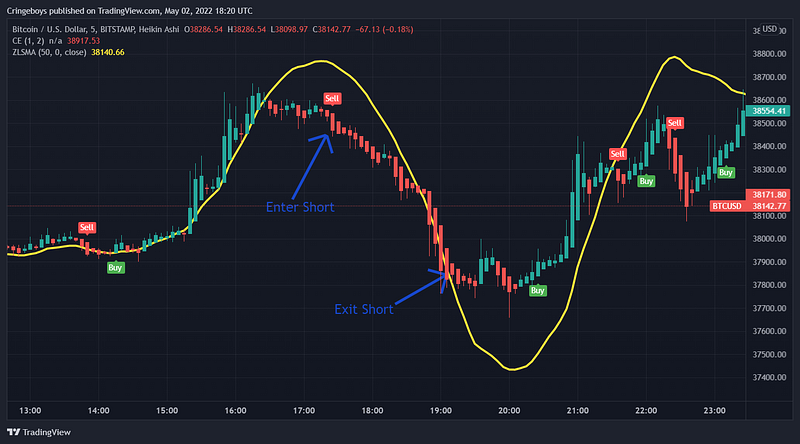
The exit was a bit of a confusing case here, but I recommend you only exiting the trade only once the candle closes completely above the Yellow line, not when it’s still hitting the candles.
Same goes for the Long strategy, wait to exit untill the candle is fully below the ZLSMA.
Risk Management
As an extra, but very important step, you want to set a stop loss at the recent local Swing High/Low.
To make this concept a little clearer, I’ll be using the two examples from earlier.
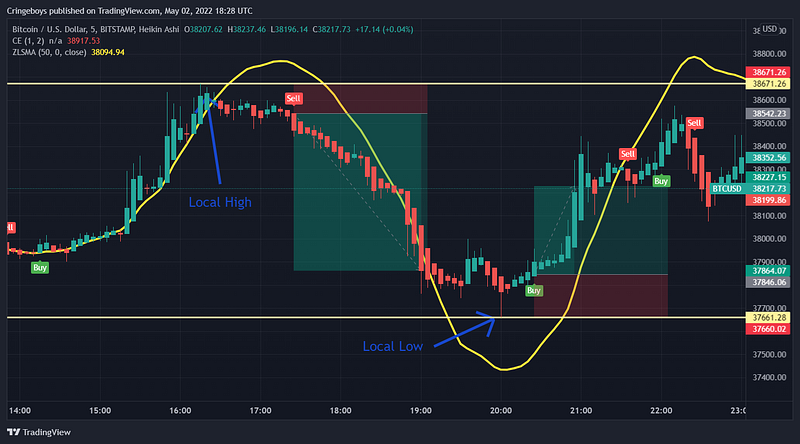
When entering a short, you want your Stop loss at the highest wick of the local high.
And obviously the reverse case for going Long.
How well does it perform?
I did some testing, and I tried it on some different time intervals, and with a couple of different Crypto assets. I even tested it on the 4h chart even though it’s a day trading strategy, but after some tweaks, it did rather well.
This little tweak which I added, is both crucial for performance and is really simple. The current problem with this indicator was, that the Exit signal would take too long activate, by the time the old Exit signal got triggered, most of the gains were already lost due to waiting too long.
So with my addition this is what the Exit signals for Longs & Short are:
Exit Signal Long
- Candle closes below ZLSMA
OR
2. Chandelier exit creates a Sell Signal
Exit Signal Short
- Candle closes above ZLSMA
OR
2. Chandelier exit creates a Buy Signal
With this addition, the Indicator looks rather promising from what I’ve tested.
I haven’t done an extensive enough testing of this indicator to provide you with Realistic and statistically correct numbers but I will be doing this in the next couple of days.
In the meantime, I highly recommend you to follow me so you can see when I put out that testing article.


