
Causal Inference
Chains, and Forks
This is the fifth post on the series we work our way through “Causal Inference In Statistics” a nice Primer co-authored by Judea Pearl himself.
You can find the previous post here and all the we relevant Python code in the companion GitHub Repository:
While I will do my best to introduce the content in a clear and accessible way, I highly recommend that you get the book yourself and follow along. So, without further ado, let’s get started!
In the previous four posts I, II, III, IV, we covered Chapter I of the book where Pearl lays down the mathematical and conceptual foundations for Causal Inference. In this post we start diving into Chapter II where we diver more deeply into Graphical Models and Their Applications.
2.2 Chains and Forks
Structural causal models allow us to encode causal mechanisms that represent the data generating process. In their graphical form, they make it easy to quickly (and often visually) to detect interdependencies in the data and enable us to reason about the model and its correctness.
The Graphical Model directly and explicitly encodes which variables depend on which others, which variables are independent conditional on other variables, etc.
Pearl illustrates this point with three simple Structural Causal Models that all have the same Graphical Model:
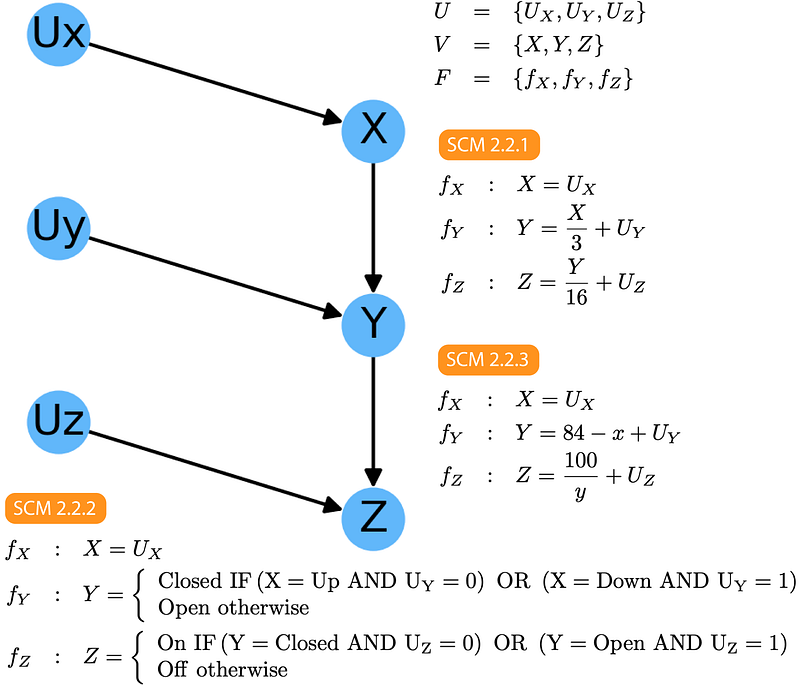
Regardless of what the exact form of the functions in F, just by inspection of the graphical model we can immediately say:
- Z and Y are dependent — P(Z|Y) ≠ P(Z)
- Y and X are dependent — P(Y|Z) ≠ P(Y)
- Z and X are likely dependent — P(Z|X)≠P(Z)
- Z and X are independent conditional on Y— P(Z|X, Y)=P(Z|Y)
The first two items are easy to understand and refine the fundamental rule of Graphical models:
Rule 0 (Edge dependency) — Any two variables with a directed edge between them are dependent
This is easy to understand as the formula for one explicitly requires the value for the other. Point 3 is a bit trickier. Z depends on Y that depends on X so, by transitivity, we can also expect that Z depends on X. However, it is possible that the specific forms of fY and fZ break this dependency. The book refers to this possibility as a “Pathological Case of Intransitive Dependence”: something uncommon that non the less we should be aware of.
Point 4 is the most interesting of all and, while apparently non-trivial it is easy to understand. If we look in our dataset and find out what the current value of Y is, that immediately helps us determine what the value of Z is (using P(Z|Y)). On the other hand, fixing the value of Y essentially isolates X from Z. Changes in the value of X are compensated by changes in the value o Uy such that Y remains fixed. This is defined in the book as:
Rule 1 (Conditional Independence on Chains) — Two variables, X and Y, are conditionally independent given Z, if there is only one unidirectional path between X and Y and Z is any set of variables that intercepts that path.
A fundamental assumption underlying Rule 1 is that the error terms Ux, Uy, and Uz are independent.
On the other hand, if our DAG looks like this:
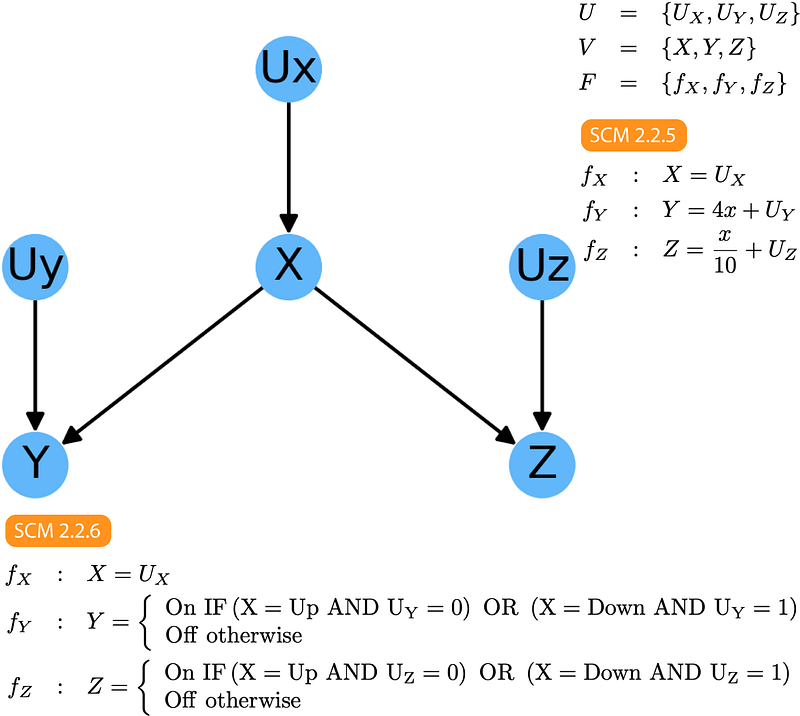
Then, following a similar reasoning, we can immediately know that:
- X and Y are dependent — P(X|Y)≠P(X)
- X and Z are dependent — P(X|Z)≠P(Z)
- Z and Y are likely dependent — P(Z|Y)≠P(Z)
- Y and Z are independent, conditional on X — P(Y|Z, X)=P(Y|X)
Points 1 and 2 follow directly from Rule 0. Point 3 is a logical consequence of the fact that Z and Y have a common cause: any specific value of X will result in specific values of Y and Z making them correlated across all values of X.
Finally, Point 4 requires a bit more thinking to properly understand, but is directly related to Point 3. If we fix the value of X, Y and Z are only allowed to vary due to their respective Uy and Uz which we assume to be independent. This result is summarized in Rule 2:
Rule 2 (Conditional Independence in Forks) — If a variable X is a common cause of variables Y and Z, and there is only one path between Y and Z, then Y and Z are independent conditional on X.
Congratulations on making it this far in these blog post series. I sincerely hope that you continue to enjoy reading them as much as I enjoy writing them.
Just a quick reminder that you can find the code for all the examples above in our GitHub repository:
The next post in this series is already out:
And if you would like to be notified when the next post comes out, you can subscribe to the The Sunday Briefing newsletter: