
Can You Have Too Many Joins? YES!
Joins are databases’ “bread and butter”, but can you actually have “too many” joins? TLDR: yes!

Joining tables is one of the most common things to do on a database. Sometimes though, you may need to outer join a long list of large tables which may lead to sub-optimal (slow) execution plans. A common example is where you need to join multiple large tables using common ID, just so you can merge different metrics and attributes (ie: attribute_1, attribute_2, attribute_3, etc). This type of pattern is very join-heavy, using left and full outer joins, and performance may suffer severely.
There are many reasons which may lead you to similar performance issues, but if you find yourself in this tight spot, the more alternative patterns you got in your toolbox the better. In this article I will show you an alternative query pattern which I have used several times with great results.
Context / Disclaimer
Tuning is very variable with the technology you are using, table sizes, cardinality (weather, mood, luck) and so on, but I guess that is also why tuning is so challenging and fun. It’s all about understanding how the database resolves queries, query behaviour, learning query patterns, and understanding that the same pattern which saved your life with query A, may actually make it worse with query B. Bearing that in mind, it’s important to point out this particular technique, though I have used it successfully on many occasions (including the real life example covered by this article), it is not a silver bullet and it may actually deteriorate your query’s performance sometimes.
I have found this technique to be useful in multiple distributed database systems (namely Spark/Hadoop, Redshift, Snowflake), but the real case scenario and prints provided in this article were all done in Snowflake.
User Attributes’ Lookup
You are running the data warehouse for a web shop, and as part of your ETL you need to lookup a set of user attributes from different tables: address, mobile number, email, nationality, the list goes on and on... All these attributes are stored in independent tables which share a common username, and all attributes consolidated inside a VARIANT/JSON column:
You run the query, and even to get the first top 100 it feels like a gigantic task, the query is taking way too much time. You decide to have a look at the execution plan, and this is what you find:
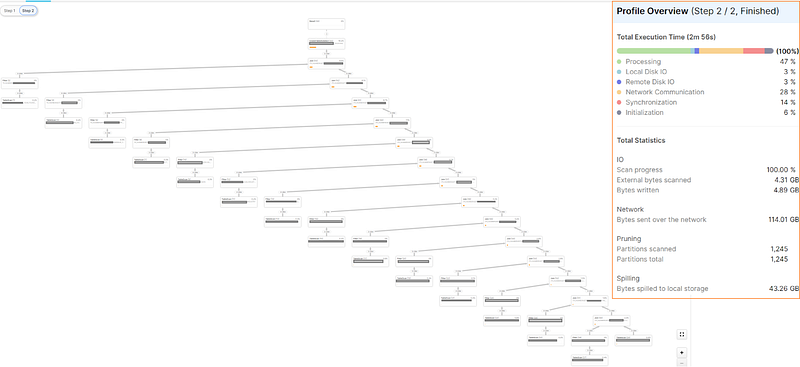
Almost 3 minutes running on a LARGE warehouse, no good. Having a closer look at the summary, one of the numbers that jumps to the eye is the 114GB of network traffic (generated out of ~5GB of data), clearly too much shuffling is happening. Now, shuffling is absolutely fine and part of a healthy query, but not when it represents almost 27 times the dataset size… that is a LOT of shuffling. Given these numbers, it’s no surprise Network Communications represent 28% of the query time (seen in colourful bar). NOTE: It is important to point out once more, the data being shuffled is mostly of VARIANT type, which will for sure have impact on these numbers.
This is how I improved this query’s performance.
Converting an Outer Join into a Union All
Applicability
This “conversion” technique only produces the same exact dataset IF the following is true:
- all tables have a common column or columns (which I will call IDs)
- the IDs are UNIQUE on all tables (this is extremely important)
- all your tables are joined by the common column(s), and you don’t have interdependencies (ie: you don’t use other columns of A to join to B)
The Conversion
Given the generic example:
then, as long as the applicability conditions are met, this query is equivalent to:
Conversion Variation for VARIANT columns
Going back to the problem at hand, in this specific problem the tables all have a VARIANT column which contains all the required attributes. Let’s remind ourselves of what the query looked like:
Now let’s see what the “alternative” query looks like:
Performance Comparison
Now, for the big question: did it work?
The answer is yes, it very much did. The query time went down from 2m56s to 1m33s (almost half the time, and most importantly, half the cost).
What does the query execution plan look like now?
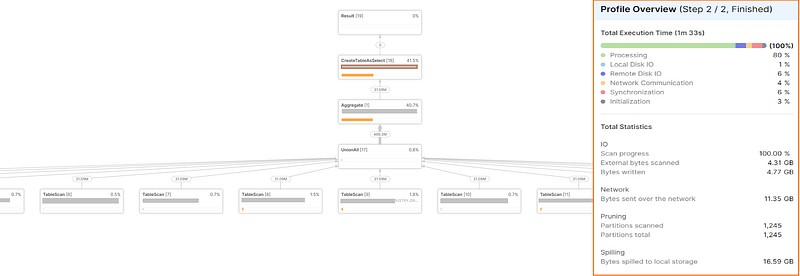
Besides the obvious change in shape (you now have all the tables feeding into the union all), the things that really brought the execution time down were the network traffic (down by ~90%), and disk spills (down by ~60%).
Why does this happen? Well, that is a very good question :P and I am open to suggestions! Feel free to use the comments box and leave your suggestion. Now, I would like to share some important notes.
Personal Notes
Note#1: I know the query does not look pretty… it can actually look atrocious, depending on how much the list of joins grow. However, if this will make the query run in half the time/cost, then it may well serve a purpose. I have seen this pattern produce unbelievable results, sometimes cutting down the time/cost by 70%.
Note#2: I know the context examples I gave have deeper issues than just performance: why on earth would you have your attributes spread out through so many tables? Well, please don’t ask, but there are “reasons”… anyway, please abstract yourself from how good/poor the example is, and focus on the new pattern.
Final Note: How cool is it, that you can actually rewrite an Outer Join as a Union All??

Conclusions
Query tuning is very unpredictable!
And maybe that is what makes it so appealing to me: when you pick up a slow query, you never know where it is going to lead you. That though, is also what makes it so hard: you never know what is going to work…
I hope you found this “technique” useful, and that it serves you as well as it has served me.
Thank you for reading my article!
Are you thinking of subscribing to Medium? Maybe you would consider support my writing by using my referral link. Note: using my link will give me a small commission with no extra costs to you.