
Can You Explain How a Bicycle Works Without a Picture?
Good luck with that!

My daughter is not a mechanic at heart. But one day she decided to learn how a bicycle actually works. No, she did not try to pull one apart — she googled it.
And she came to me all riled up:
I’ve tried to look up how a bicycle works, and some of the websites don’t even have pictures! How can you explain this without a picture?
Indeed, how can you?
Even if you believe you can explain this without pictures, will others understand your explanation?
Have you ever tried to describe a difficult concept to anyone? Did you grab a piece of paper, or took a marker to the whiteboard? I do it all the time. And it usually works better for both the presenter and their audience.
Many people find it much easier to explain something by drawing a map, or a model, or a little flowchart. Drawing is faster, it can get you straight to the point in a third of a time it would take to form complex sentences. And it can make something clearer with a line, or a splash of color.
Yet, visuals and diagrams are often underused in business situations where they would be invaluable.
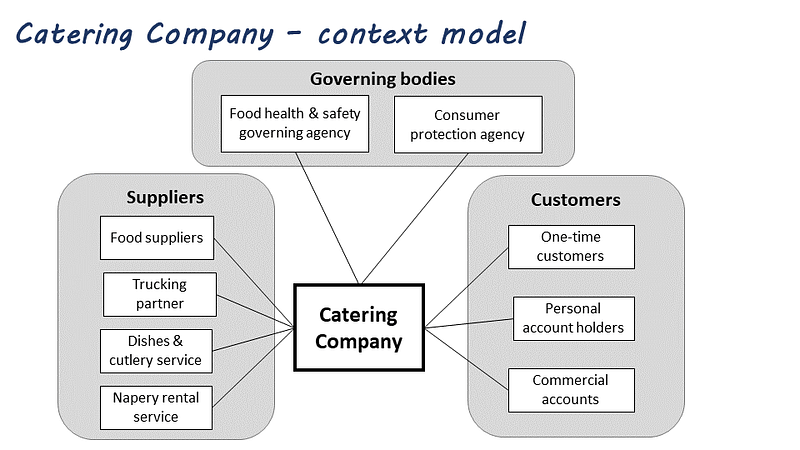
A stakeholder impact analysis will be more meaningful with a context model:
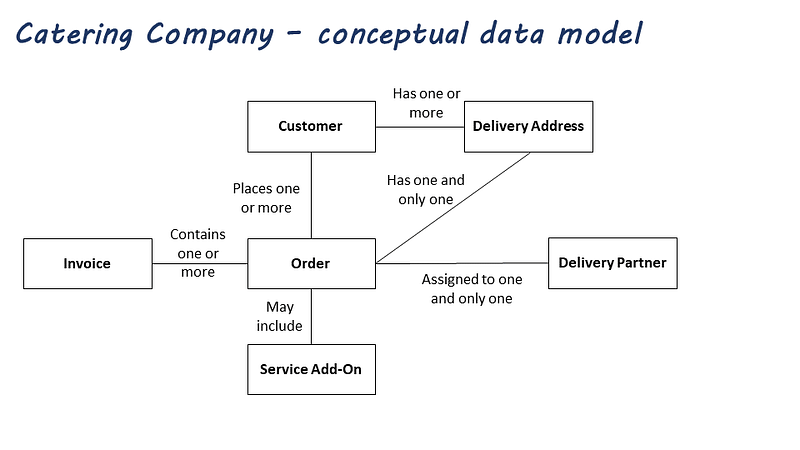
Glossary definitions and rules can be compressed into a table complemented by a conceptual model:
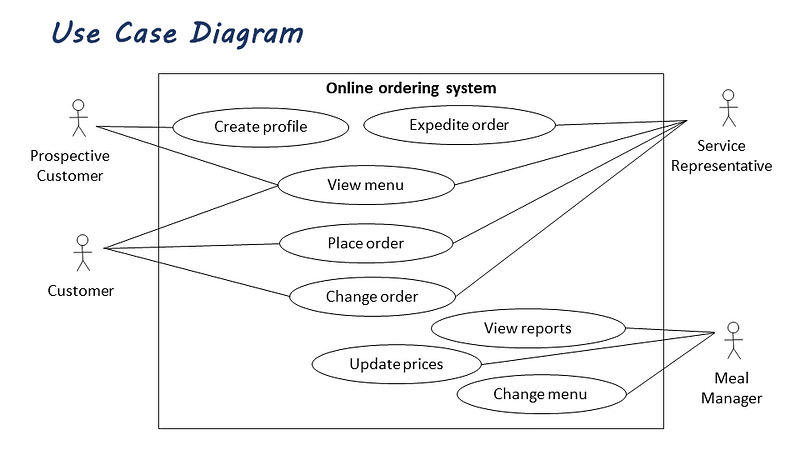
A long description of the scope of a new system can be replaced by a use case diagram:
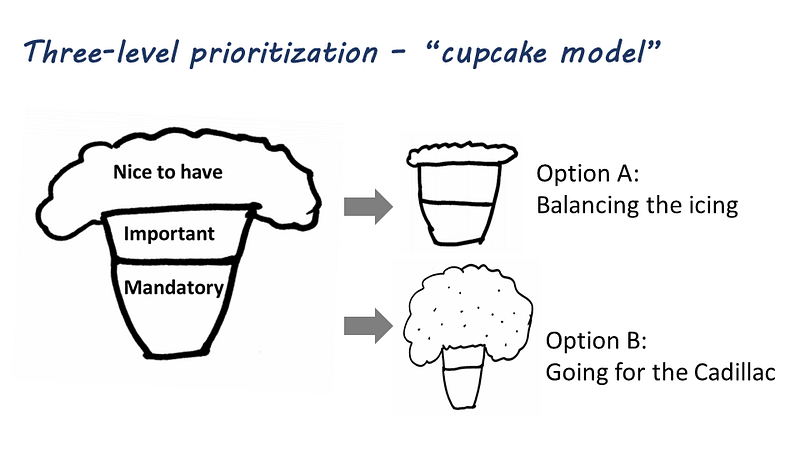
And a difficult discussion about the value of nice-to-have requirements can be helped along with a humorous or silly picture:
I don’t know about you, but I have never heard anyone complaining about too many diagrams. No requests to get rid of a confusing picture and simply write down in plain English what it means. It is usually the other way around.
Enterprise architecture boards, strategic committees, program offices, and business analysis teams could communicate more efficiently with the help of models, maps, and diagrams.
Who can help with that?
Business analysts and architects are experts in communicating complex concepts visually. Their repertoire includes a variety of analysis and modeling activities:
- Capturing the current state of business in a business capability map
- Depicting and analyzing process flows
- Understanding (and explaining to others) the relationships between business entities and concepts
- Investigating the root cause of a problem
- Creating a vision of a future product or process
- Capturing user experience
- Storyboarding games and interactions
Making pictures and visuals that convey a message is not a dark art. It is a skill that can be learned, even if you think you can’t draw.
You can start with any standard office software, such as MS Office. Even MS PowerPoint can fulfill 80% of basic diagramming needs. For advanced modeling, there is a variety of tools on the market that support UML, BPMN, TOGAF or ArchiMate notations. Learning these modeling notations will give you a competitive edge in many situations.
If I could convince you of one thing today, it would be this:
Whenever you need to communicate a difficult concept, supplement it with a visual.
Most of your audience will appreciate it.
And adding a visual may shorten your explanation by a few hundred words, or even the proverbial thousand.
“Of all of our inventions for mass communication, pictures still speak the most universally understood language.” — Walt Disney
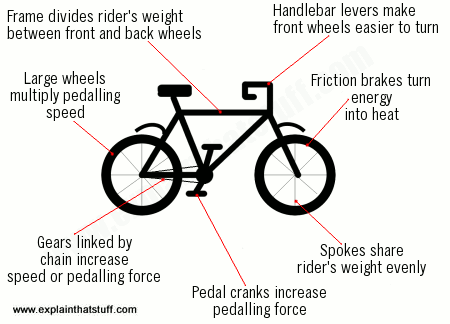
Before I forget, here is a great picture for someone who needs to understand the basics of bike mechanics. I found it on a website with lots of pictures, very aptly named explainthatstuff.com.
I write about business analyst mindset, architecture, change, communication, and waste. I love pictures and models. If this interests you, join my mailing list for practical analysis & architecture insights.


