
Can We Use Simple Technical Analysis Time the Bottom of the Bear Market?
Using the RSI, trend lines and Python to investigate when the market bottom will occur

As a swing-style trader, the bear market of 2022 has not been too kind; I’m sure many longer term traders/investors are also sharing that sentiment. How do we know when it’s all going to end, and when it’s safe to move from mainly cash back to positions in the market?
My suspicion is that no one can really time this perfectly, after all, the saying “time in the market beats timing the market” does hold some weight. However, there are examples such as this video by the Financial Wisdom channel who suggest it may all be over soon.
The strategy laid out in this video is based on technical analysis, using:
The principle idea is that if we have increasing RSI but a decreasing price action, then we are in a “bullish divergence” phase — i.e. market momentum is strengthening and price could soon move in the direction of the indicator.
Using Python, I was able to implement a simple bit of code to perform such analysis, and produce visualisations to investigate this myself; as an example, here is the outcome from the end of the 2008 financial crisis:
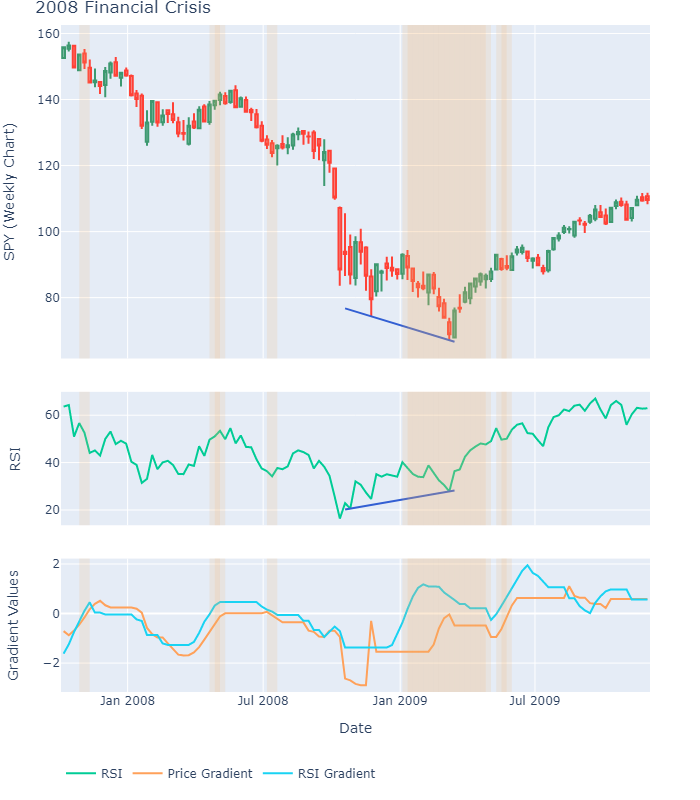
The key areas are those highlighted in orange, these are where the Python code detected bullish divergence. It gave a pretty strong band towards the market bottom, and besides one false signal, the highlighted regions give a good prediction of a countertrend rally.
Throughout this article I will describe:
- How the code detects the bullish divergence.
- How the method performs on the 2001 Dot-Com bubble.
- Importantly, what this method says about the current market.
Please see the end of the article for the full code 🙂
The Technical Analysis Approach
Personally, I found the examples laid out by the financial wisdom channel a little too discretionary for my taste, which is precisely why I looked to an implementation with code. As described in the introduction, the approach requires two key ingredients:
- The 14 period RSI — this will be generated using the TAlib Python package.
- Support trend lines — using an algorithm I developed
The idea is that we are going to find support lines over a fixed window length (I used 22 weeks) at the close of each week; these lines are determined for both the RSI and the price action. Once the support lines are found, we can determine the gradient value for each to compare for a divergence in the slopes. The rules are then simple:
- If the RSI gradient > 0 and the price action gradient < 0, then we are in a bullish divergence phase.
- Else, ignore!
Wait, why are you using 22 weeks!?
To be totally transparent, this is what visually looked best over the 2001 and 2008 bear markets — with the code you can try a number of window lengths to see if you find out anything else interesting!
Typically, shorter windows introduced more false signals; longer windows missed some major market movements entirely.
Besides, 22 weeks is roughly half a year, which seems a reasonable length to measure larger market changes.
Please can you summarise how the trend line algorithm works?
Sure! Basically, to draw a trend line algorithmically, we find the gradient and intercept parameters for the equation of a straight line:

For support lines, we want to find the line that cuts through the minimum point over that window, and minimises the distance between the line and each other point. Resistance lines are the opposite where it cuts through the maximum.
The article linked below describes this in a lot more detail!
The 2001 Dot-Com Bubble
The next most notable bear market in history is surely the 2001 Dot-Com bubble; so how did the code perform here?
Well… not entirely great, but I’ll let you make up your own mind:
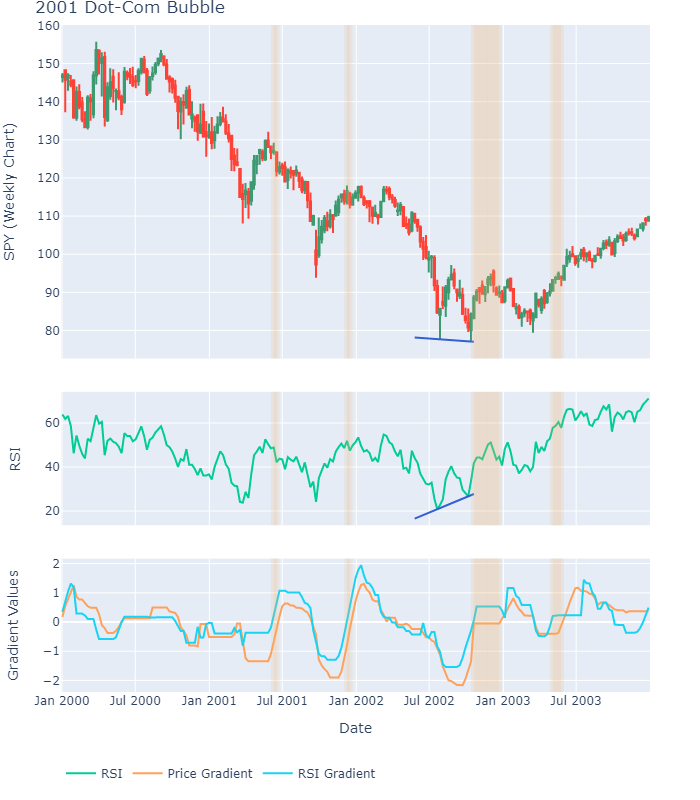
It does indeed give a signal that the bear market is coming to an end, but weeks before any uptrend starts. Likewise, the “false-signals” do not time any counter trend rallies well.
Perhaps a little adjustment of the codes hyperparameters will give a better result, but you’re then at risk of overfitting to get the result we desire.
The 2022 Bear Market
How about the recent market condition?
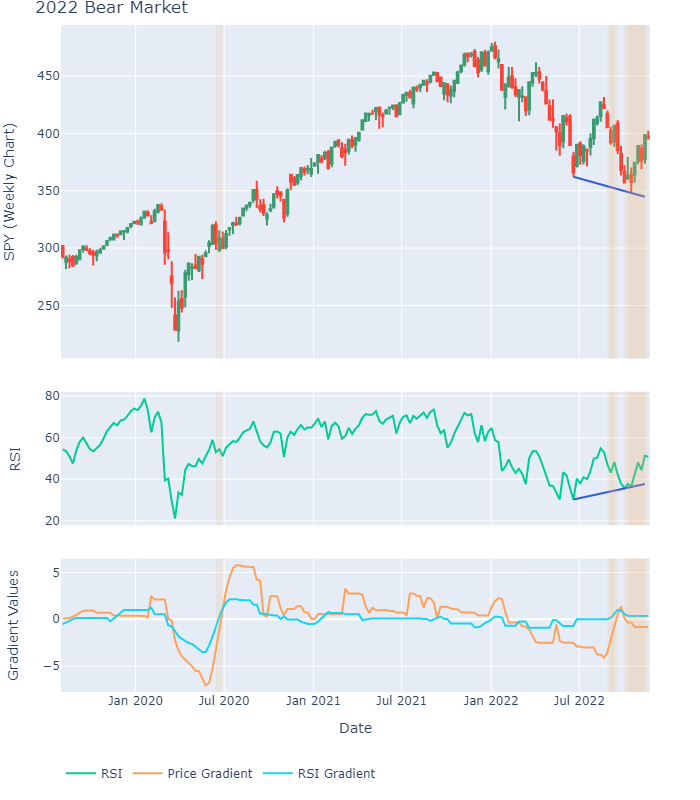
If the method is to be believed then we are indeed coming out of the bear market. The optimist in me wants to believe this is true, the pessimist believes that it is almost too easy to tune these parameters to get a nice result, and therefore find a pattern that really isn’t there.
Note! The 2020 flash bear market was also included here, the method completely mistimed the bottom; however, this is likely because of the large window size I used. A shorter window is likely required for such quick drops.
⚠️Please do not take this as advice on timing the market. This post is for educational purposes only and you should do your own testing/validation before believing anything on the internet! ⚠️
Wrapping Up
Overall, I quite like the principles of this method and the results are somewhat interesting. However, it is incredibly easy to overfit these observations based on the fact we have, well, two main examples. A more in-depth study could be to tune these parameters to catch the end of countertrend rallies in bull markets, or perhaps to flip the situation and consider market tops.
Personally, I won’t be using this indicator as a measure of re-entering the market fully. I think I’ll take Mark Minervini’s advice and let the stock setups guide me!
Thank you for reading, I hope you enjoyed the article! Please feel free to connect with me on LinkedIn — I’d love to hear from you! Also feel free to follow/DM me on twitter.
If you are thinking getting a medium account, then please consider supporting me and thousands of other writers by signing up for a membership. For full disclosure, signing up through this link grants me a portion of your membership fee, at no additional cost to you (a win-win for sure!).
Or if you’d like another way to support my content creation, then you could

Because I work a full-time job, go to the gym, trade, and write on Medium, I use a lot of coffee!
The Full Code
Subscribe to DDIntel Here.
Visit our website here: https://www.datadriveninvestor.com
Join our network here: https://datadriveninvestor.com/collaborate