
Can We Beat The Bookies? Predicting Football Games With a Simple Model
Predicting football games’ results in Premier League, La Liga, Serie A and Bundesliga.

Football is considered one of the most beautiful games because of how unpredictable it is. Underdogs’ wins and comebacks make some games hard to predict, even for expert bettors.
However, things change when it comes to making a model that predicts all the games in a league. A season is a long competition with many ups and downs for even the most powerful clubs, but in the end, just a couple of teams are serious candidates to win a league. It’s no coincidence that the winners of La Liga, Serie A and Bundesliga were almost the same in the last decade.
As a bettor, I know that I can’t predict that Liverpool would lose 7 -2 to Aston Villa, but as a data scientist, I know that it’s possible to make a simple model that helps increase the chances of winning a bet.
Let’s predict football games matches for the top 4 European leagues! First, I’ll show you where you can get the data I’m using, then we’ll build the model together and in the end, I’ll tell you how this helps me in sports betting.
The Data
We need three inputs to build the model: historical data, the current table, and the matches left. Luckily, the historical data of football matches in many leagues are ready to use in CSV format on this website.
Although the website contains football data for many seasons, I‘ll only consider the past 5 seasons. There’s some debate about how much historical data is necessary for building a model. In my experience betting on football, I consider the last 5 years enough to make good predictions.
Too much past data could make our model less accurate. Football clubs, rules and players change a lot over the years. Ten years ago, there was no VAR to correct referee decisions and 15 years ago, there was no Messi winning games on his own for Barcelona.
Note: I also used this data to build a profitable betting tool with Python’s Selenium and Pandas. In the article below I show the full code and explain how I did it.
Historical Data
You could download the .csv files one by one or let a Python for loop do the job for you with the following code:
With this simple code, we stored the data from season 15/16 in a dictionary called dict_historical_data. After this, we just have to rename the keys. For example ‘SP1’ represents ‘la_liga’. Those details can be found on my Github.
Current Table and Matches Left
There are many websites that show the current positions and the matches left in many leagues. Just google it and copy and paste the necessary data.
I already built a CSV file with the table and upcoming matches for the top 4 leagues. You can find the files on my Github.
The Math Behind
We should always know the math before writing any code and this time is no exception.
If you watch a football game at least once, you know that a player could score a goal at any time during the match. This is a histogram of the number of goals in every match over the past 5 years for the top 4 leagues.
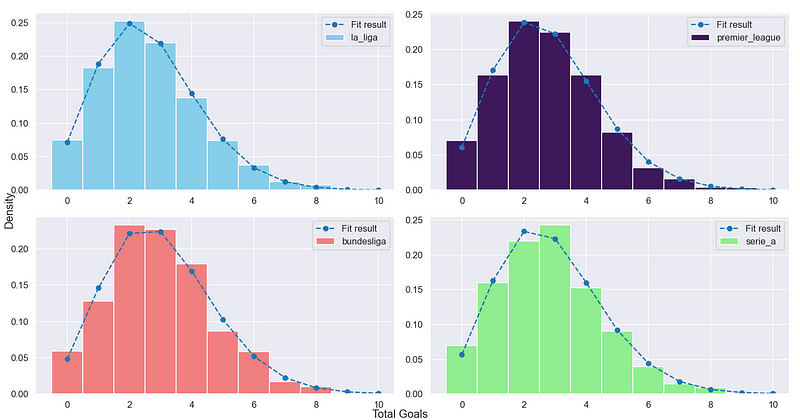
It’s no surprise that Bundesliga has the highest average number of goals (2.91), but if you see the 4 graphs closely, you’ll notice that all of them have something in common — their distributions have a common fit curve. It’s the Poisson distribution!
Why the Poisson distribution?
Some of the reasons are these:
- Football games are independent of each other. The occurrence of one game/goal does not affect the probability of another game/goal.
- The exact timing of events is random. The timing of a goal is random.
- Goals are a discrete variable because they’re countable. A football match can have 1, 2, 3 goals but not fractions.
Above all, we’re trying to make this simple. We could add more variables to increase the accuracy of predictions, but for now, let’s do it the easy way.
So we’re dealing with a discrete probability distribution of the number of events occurring in a given time period. If we consider a goal as an event that might happen in the 90 minutes of a football match, this makes more sense.
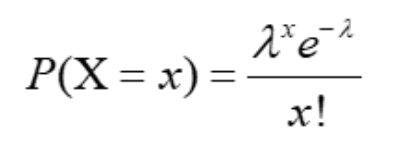
As we can see in the formula above. The Poisson distribution requires 2 inputs lambda and x. In our analysis lambda would be the median of goals in 90 minutes. This could be the median of goals of a home team, away team or in the league. On the other hand, x is the number of goals in a match that could be scored by Team A or Team B.
Let’s Build The Model
To predict the winner of a match, we need to calculate a team's strength within a league. To do so, I use the function calculate_strength that returns a data frame with a normalized number of goals scored and conceded by all teams that played in the top 4 leagues over the past 5 years.
Below you can find an example of the strength of Premier League teams. For example, Manchester City is the team with the best attack at home, while Leeds has one of the highest numbers of goals conceded in away matches.
A game between these two teams would increase the number of goals in the match and also increase the chances of Manchester City winning the match.
After obtaining the strengths for the 4 leagues, we create another function that simulates all the possible outcomes between all the remaining games. This function uses the previous one that calculated the strength of each team. Lambda was calculated with the formula lambda = home_scored * away_conceded that represents the probability of a goal scored by the home or away team.
Also, we need to set limits for the number of goals used in the simulations. Since teams like Bayern Munich are setting the bar high lately, we’ll use a limit of 10 goals scored for each team at most.
For each iteration, we calculate the Poisson formula previously shown. In this case, the parameters are the number of goals scored (x) and the average goals scored (lamb_home and lamb_away). Instead of writing the formula, we use poisson.pmf function from the scipy library.
The result would be classified into 3 categories: win, loss or draw. After that, we use the formula 3*prob_home + prob_draw to find how the 3 points in the football match are distributed between the 2 teams. When the chances of a home team to win the match are 100%, then points_home would be 1 and the home team would get 3 points. The same idea goes for draws.
Finally, we execute the 2 functions created with the following code:
Inside the for loop, we store the results of each game in list_points_home and list_points_away and also, we update the table after every game is simulated.
The prediction for the 4 leagues are the following:
Here you can find the result of each game in the season.
How Can You Use This For Sports Betting?
These predictions are helpful if you like to bet on full-time live results (1x2). Imagine a favorite team is losing in the first half, then betting on a comeback or a draw would pay way more than betting on the prematch. However, before placing a bet, you should also consider the underdog's chances of winning the match.
This is when the model comes in handy. By searching the team name in the prediction table, you can easily see their chances of winning and decide if they’re good or bad underdogs.
I’ll use Bayern Munich as an example. Bayern’s previous first-half results were 0–2 (losing to Mainz) and 2–2 (draw with Borussia M’gladbach). We don’t need the model to remind us how a great team is Bayern Munich, but if you know little about Bundesliga, the model can show you the chances of Mainz holding the victory or Borussia M’gladbach keeping the draw.
By typing the name of a Bundesliga team in the table above, you will obtain that Mainz has a score of 0.5, which means low chances of winning the match even though they’re 2 goals ahead. On the other hand, M’gladbach has 0.8 when playing home, which isn’t bad if you compare it with other Bundesliga teams.
If we knew nothing about Bundesliga, we could say that M’gladbach has more chances of at least getting a draw than Mainz winning or obtaining a draw.
These were the real results of the matches:
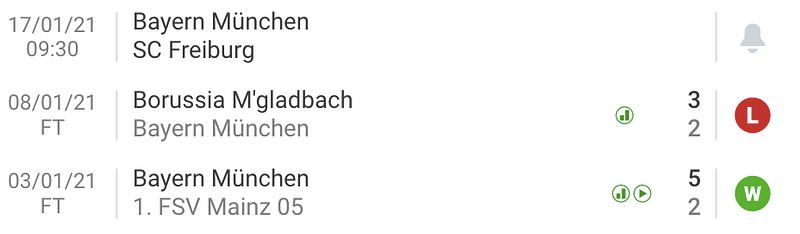
So the model is helpful after all! M’gladbach even managed to win the match. Naturally, if you use this as a guide to betting in the prematch, the profit would be little, but if you use it wisely when the favorite team is not winning, then the returns would be higher.
These are just 2 matches. Hopefully, at the end of the season, I’ll be able to make a better comparison.
Final Thoughts
This model is far from perfect. Actually, its simplicity makes it less proper for certain scenarios. For example, in the analysis of a football match, I only considered head to head historical data. In real life, this would not be enough for me to place a bet. I’ll still need data about the performance of the home team playing home and away team playing without the home advantage.
I still consider it really good for predicting leagues’ winners and a good guide when a favorite team is not winning a match. In a league or a cup, football teams have many ups and downs, but at the end of the day …
Football is a simple game — 22 men chase a ball for 90 minutes and at the end, the Germans always win


