
Calibration of Models
Calibration means getting output in the from of probability rather than class labels in classification problems.
Need of calibration
While solving classification problems we often want not only to predict the class label, but also obtain a probability score of the respective label so that probability score gives us some kind of confidence on the prediction. For e.g. Suppose a model is predicting whether a patient has cancer or not. Now rather than getting 0 or 1 as output we want probabilities of labels as output as it gives us more confidence that our model is doing predictions right.
Some classification models can give poor estimates of the class probabilities and some even do not not support probability prediction. The calibration module allows us to better calibrate the probabilities of a given model. Calibration adds the support for probability prediction.
In some applications, getting probability as output makes model more interpretable. If we comparing two text sentences similarity we can set threshold so that if probability is coming above that threshold let’s say 0.8 we say that sentences are similar.
What does Calibration Change?
If you use AUC as a model evaluation metric, you cannot see any difference before and after calibration, because AUC cares about distinguishing the classes, not the probability of them. However, if you use a metric such as Log Loss that works with the likelihood function, you see the difference before and after calibration in performance of models.
Calibration plots
Calibration plots are also called reliability diagrams.
It is a line plot of the predicted probability frequency (x-axis) versus relative frequency of actual probability value (y-axis).
Calibration plots are drawn by taking cross validation data set and get predicted scores on it and these scores are sorted in either ascending or descending order.Now, divide whole data set into equal sized chunks. Take average of actual ‘y’ and predicted scores for each chunks. Now, plot average of actual y on y-axis and average of predicted scores on x-axis.
We can also use calibration_curve function in scikit learn library in python.
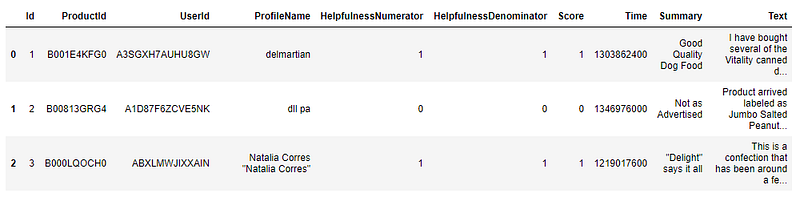
Now, we take “amazon fine food reviews” data set and plot calibration curves on it. Download data set can be from here.
Our objective is to classify text reviews into positive and negative reviews. First we preprocess the text reviews and vectorize it by using Bag of Words and then apply Support vector machine and logistic regression on it.
Logistic Regression returns well calibrated predictions by default as it directly optimizes log-loss. In contrast, the other models return biased probabilities with different biases.
Let’s look at this Data set:
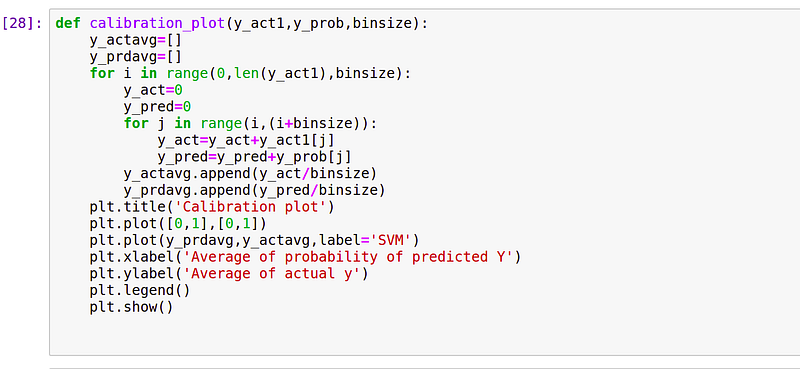
Plotting calibration curve without using sklearn calibration_curve.
We are using SVM model.
- Train a SVM model and sort the predicted probability scores in ascending order.
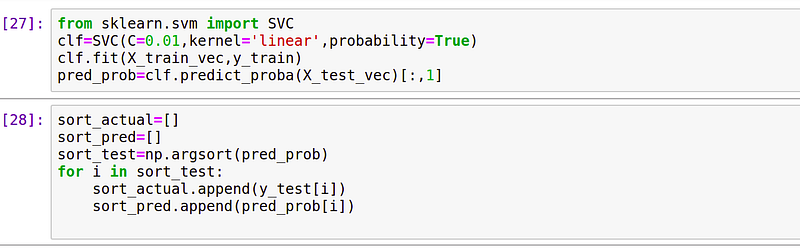
2. Divide the sorted probability and actual y into multiple bins. Here, we are taking bin size as 50.
3. Take the average of actual ‘y’ and predicted probabilities for each bins.
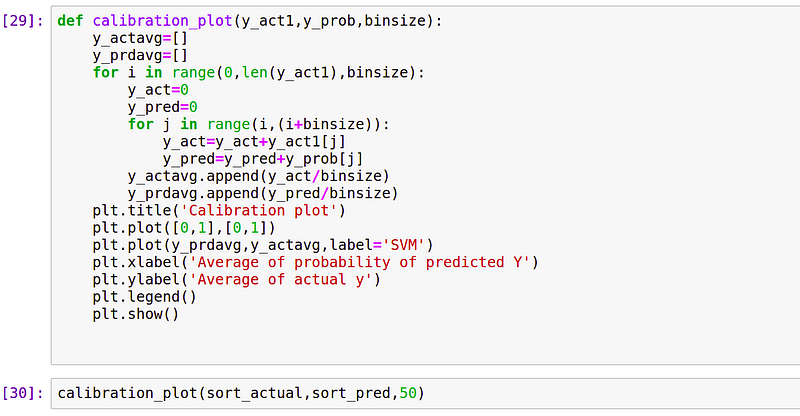
4. Plot average of actual y on y-axis and average of predicted probability on x-axis.
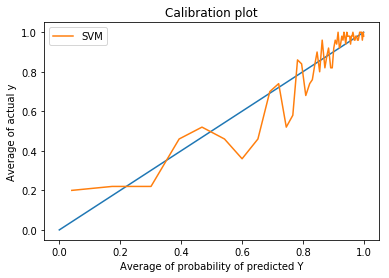
From the above plot, we can see that the calibration plot on cross validation data is distorted from ideal straight line.
Plot calibration curve by using sklearn calibration_curve.
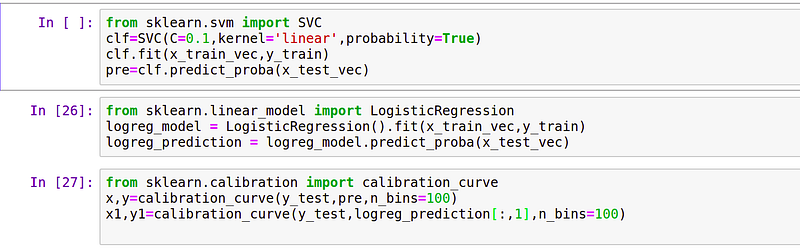
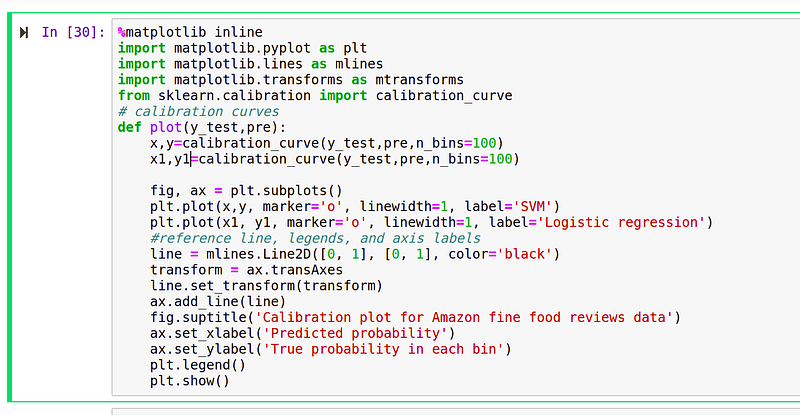
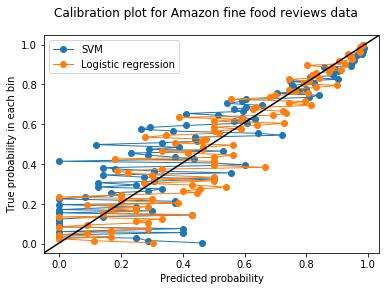
Here, as we can see the calibration plot for amazon fine food reviews taking 20k data points and divided into bin size of 100 and applying logistic regression and support vector machine as models.
Calibration curve are useful for selecting calibration techniques like for e.g., if distortion in curve is sigmoidal in shape then we use platt scaling.
Calibration Techniques
There are two approaches for performing calibration of probabilistic predictions are:
- Platt calibration
- Isotonic regression
Platt Calibration:-
Platt scaling or Platt calibration is a way of transforming the outputs of a classification model into a probability distribution over classes.
The method was invented by John Platt in 1999 for transforming predictions to posterior probabilities by passing them through sigmoid.
P(y = 1|f(x)) = 1/( 1 + exp(A f(x) + B))
It’s a logistic transformation of the classifier scores f(x), where A and B are two scalar parameters that are learned by the algorithm or can be found out by using optimization algorithms like Gradient descent.
The parameters A and B can be estimated using a maximum likelihood method that optimizes on the same training set as that for the original classifier f.
Now, predictions can be made according to y = 1 iff P(y=1|x) > ½; if B ≠ 0, the probability estimates contain a correction compared to the old decision function y = sign(f(x)).
Platt’s scaling only works when calibrate plot is sigmoidal and if it is not sigmoidal in shape then it fails so we use isotonic regression.
Lets, apply platt calibration on above amazon fine food reviews data set.
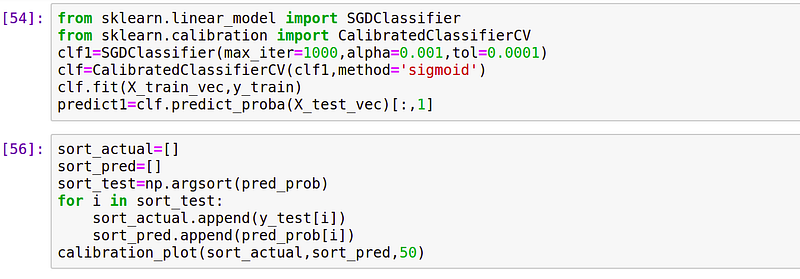
Steps for applying platt scaling
- Split the data set into train and test data set.
- Train the model on the training data set.
- Apply SGD Classifier to minimize hinge loss.
- Apply Calibrated Classifier from sklearn and take SGD classifier as a base estimator.
- Sort the predicted probability scores in ascending order.
- Divide the sorted probability and actual y into multiple bins. Here, we are taking bin size as 50.
- Take the average of actual ‘y’ and predicted probabilities for each bins.
- Plot average of actual y on y-axis and average of predicted probability on x-axis.
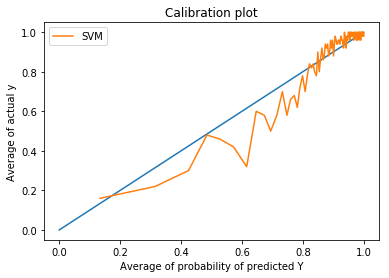
We can clearly see that in platt scaling the curve is close to line except at some points its far so platt scaling has improved probability scores.
Platt scaling works well for SVMs(Support Vector Machine) as well as other types of classification models, including boosted models and even naive Bayes classifiers, which produce distorted probability distributions.
Isotonic regression
Zadrozny and Elkan (2001- 2002) successfully used a more general method based on Isotonic regression to calibrate predictions from SVM, Naive Bayes, boosted Naive Bayes, and decision trees.
Isotonic regression is the technique of fitting a free-form line to a sequence of observations under the following constraints:
- The fitted free-form line has to be non-decreasing (or non-increasing) everywhere.
- It has to lie as close to the observations as possible.
A benefit of isotonic regression is that it is not constrained by any functional form, such as the linearity imposed by linear regression, as long as the function is monotonic increasing.
This method is more general in that the only restriction is that the mapping function should be isotonic (monotonically increasing).
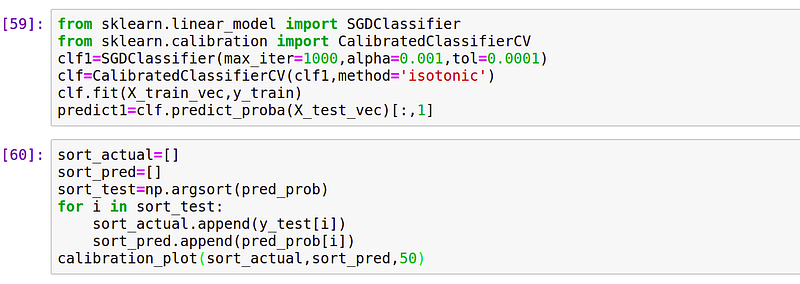
Lets, apply isotonic regression on above amazon fine food reviews data set.
In platt scaling we have used method as sigmoid in calibrated classifier cv and in isotonic we used method as isotonic in calibrated classifier cv and rest of the steps are same for isotonic and platt scaling calibration techniques.
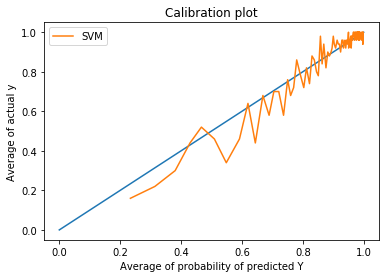
In isotonic calibration curve is not too far from ideal line and in platt scaling for some points line is far from center line.
Isotonic regression has applications in statistical inference. For example, one might use it to fit an isotonic curve to means of some set of experimental results when an increase in those means according to some particular ordering is expected.
Let’s take a look at isotonic regression with respect to linear fit.
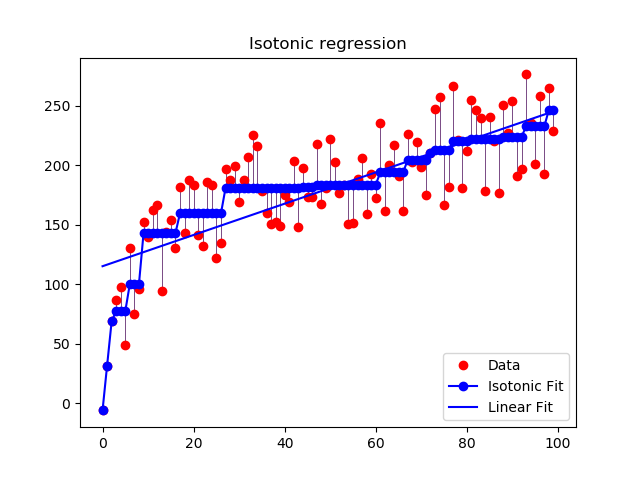
As we can see from the above graph that applying the linear fit to data produces large error and this is underfitting as data points are very far away from the line and not fitted properly but in isotonic fit,by using sequence of lines and setting threshold for line for e.g., if threshold is between 2 to 5 then the line l2 will be used i.e., we will use the equation of line l2 (y=mx+c) and fit the data points to line l2 to minimize the miss classifications.
In the above graph we can see several dotted blue lines and they are fitting the data points.Thus, isotonic line has less errors as compared to linear line.
Multi-class classification
CalibratedClassifierCV can also deal with classification tasks that involve more than two classes if the base estimator can do so. In this case, the classifier is calibrated first for each class separately in an one-vs-rest fashion. When predicting probabilities for unseen data, the calibrated probabilities for each class are predicted separately. As those probabilities do not necessarily sum to one, a post processing is performed to normalize them.
Conclusion:
CalibratedClassifierCV allows to improve the quality of predicted class probabilities of binary and multi-class classifiers.
Platte Scaling is most effective when the distortion in the predicted probabilities is sigmoid shaped and if it is not in sigmoid shaped then we can use isotonic regression.
For large training sets use isotonic regression and for small training sets use platte’s scaling.
Hope you get an overview regarding calibration of models.
Cheer’s
References:-


