
Calculating Mean, Median and Mode in BigQuery
Straight-forward code to calculate the simple aggregations
BigQuery is a fast-processing analytical tool that processes SQL queries on the Google Cloud Platform. In this article, I will show code examples to calculate the mean, median and mode of a simple dataset in BigQuery. Whenever we start exploratory data analysis, these are the first few metrics to calculate on the numerical fields to understand the distribution of the data.
If you would like to learn more about these 3 summary statistics, you can look into this comprehensive video by Khan Academy.

Dataset
We’ll be using the FIFA World Cup Dataset from Kaggle. This is one of the most downloaded datasets and it contains the results of the football games that occurred every 4 years, starting from 1930. The questions we are interested in are:
- What is the average number of goals made by the home teams each year?
- What is the middle value of the goals made by the home teams each year?
- What is the most frequent number of goals achieved by the home teams in each year?
Note that we will be computing stats for each year the games were played.
Let’s start by loading the dataset into a BigQuery table using the upload function. If you are not familiar with the upload process, you can visit this page on Loading data from local files. To calculate these 3 stats, we want to focus only on 2 columns in the dataset:
- Year — Year of the World Cup played
- Home_Team_Goals — Numerical column that contains the number of goals scored by the home team
Mean
The simplest of all. This can be achieved by a simple aggregation function AVG() . Since we are computing the mean number of goals for each year, we will use the GROUP BY clause.
NOTE: We are using ORDER BY to make sure the results are displayed in chronological order
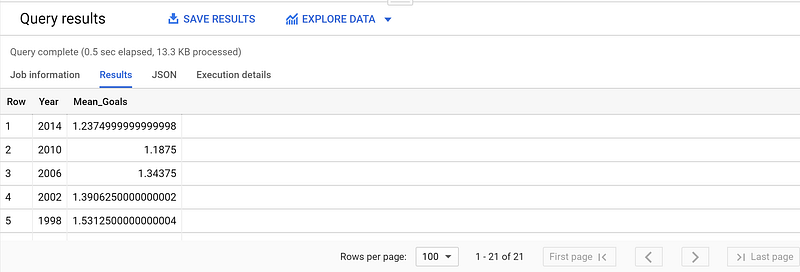
The mean goal of the home teams has decreased from 1.53 to 1.23 goals between the years 1998 and 2014. #Can this suggest that the teams have become tougher and it is harder to score a goal in recent years? It needs more information to conclude this.
Median
Unfortunately, BigQuery does not have a straight forward median calculation. We need to calculate Median as an analytical function here (as opposed to using aggregate function for mean). If you are not familiar with analytic functions, you can learn more about it in the Google BigQuery Reference Document.
Median is the middle value, which equals to the 50th percentile of a sample set. To calculate the percentile at 50%, BigQuery has 2 functions: PERCENTILE_CONT(x, 0.5) and PERCENTILE_DISC(x, 0.5)(for integer outputs). Note that we have to use OVER clause to calculate the percentile by year, as it is an analytic function.
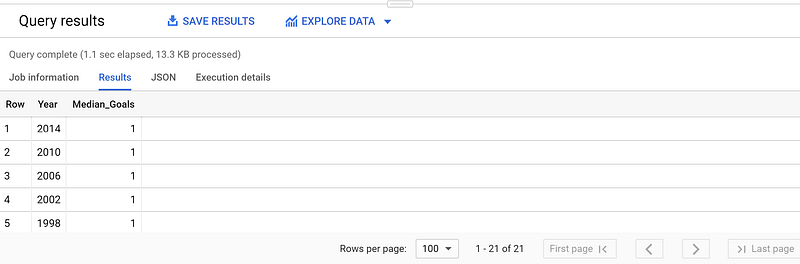
I used the PERCENTILE_DISC(x,0.5) clause to get the median as I wanted to get the discrete number of goals. You can see that the median number of goals has stayed consistently at 1, indicating half of the home teams score 1 or 0 goals.
Mode
If you know SQL, you would be using TOP clause for the calculation but BigQuery does not haveTOP clause. Hence we will use COUNT to calculate the frequency of each Home_Team_Goals and then useROW_NUMBER() to filter the Top 1 value (the most frequent value). As you might have noted, we will be using COUNT as an analytic function here as well.
Notice how we have a sub query that calculates the aggregation over each Home_Team_Goals and an overall query that filters the Top 1 value using the ROW_NUMBER() for each year.
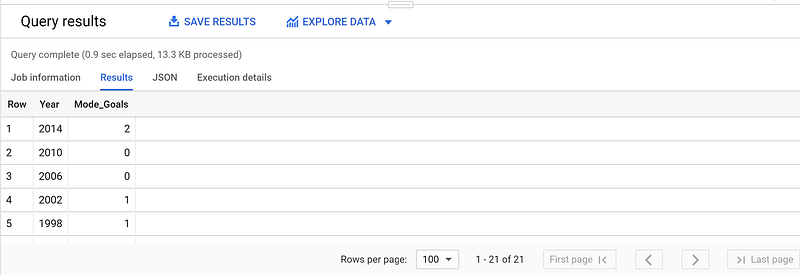
In the above results, you can see that the most frequent number of goals made by the home teams has increased to 2 in 2014.
Now that we have calculated the mean, median and mode, we can infer on the distribution of the number of goals by the home team. I hope you found this helpful to explore your data to make meaningful inferences!


