
10 Regression Metrics Data Scientist Must Know (Python-Sklearn Code Included)

import numpy as np
from sklearn.metrics import *
Python Functions
- Mean Absolute Error
Definition from Wikipedia:
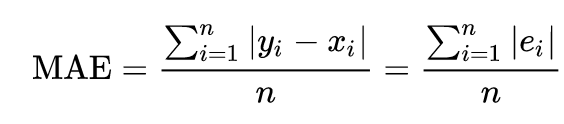
Mean Absolute Error (MAE) is a measure of errors between paired observations expressing the same phenomenon. Examples of Y versus X include comparisons of predicted versus observed, subsequent time versus initial time, and one technique of measurement versus an alternative technique of measurement.
Formula:
def mae(y_true, y_pred):
    """
    Mean absolute error regression loss.
Args:
y_true ([np.array]): test samples
y_pred ([np.array]): predicted samples Returns:
[float]: mean absolute error
""" return mean_absolute_error(y_true, y_pred)2. Mean Square Error
Definition from Wikipedia:
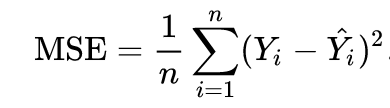
Mean squared error (MSE) of an estimator measures the average of the squares of the errors — that is, the average squared difference between the estimated values and the actual value.
Formula:
def mse(y_true, y_pred):
"""
Mean squared error regression loss.
    Args:
        y_true ([np.array]): test samples
        y_pred ([np.array]): predicted samples
Returns:
[float]: mean squared error
""" return mean_squared_error(y_true, y_pred)3. Root Mean Square Error
Definition from Wikipedia:
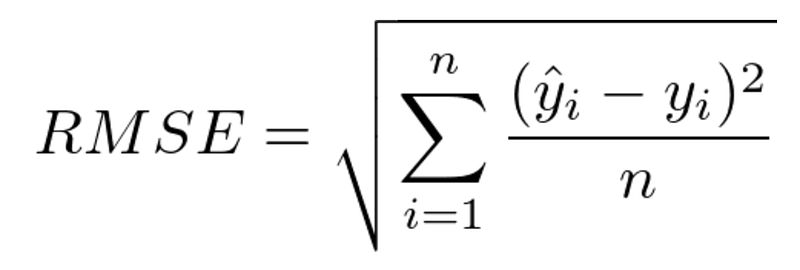
Root-mean-square error (RMSE) is a frequently used measure of the differences between values (sample or population values) predicted by a model or an estimator and the values observed. It represents the square root of the second sample moment of the differences between predicted values and observed values or the quadratic mean of these differences.
Formula:
def rmse(y_true, y_pred):
    """
    Root Mean Square Error
    """
return np.sqrt(mean_squared_error(y_true, y_pred))4. Root Mean Square Logarithmic Error
Definition:
Root-mean-square logarithmic error (RMSLE) is the root mean squared error of the log-transformed predicted and log-transformed actual values. RMSLE measures the ratio of prediction and actual.
def rmsle(y_true, y_pred):
    """
    Root Mean Squared Logarithm Error
    Args:
        y_true ([np.array]): test samples
        y_pred ([np.array]): predicted samples
Returns:
[float]: root mean squared logarithm error
"""
for i in range(len(y_true)):
if y_true[i] < 0 or y_pred[i] < 0:
continue return np.sqrt(mean_squared_log_error(y_true, y_pred))5. R²
Definition from Wikipedia:
R² (also known as the coefficient of determination in statistics) is the proportion of the variation in the dependent variable that is predictable from the independent variables.
There is a clear explanation in the video below:
def r2(y_true, y_pred):
    """
    R^2 (coefficient of determination) regression score function.
    Best possible score is 1.0, lower values are worse.
Args:
y_true ([np.array]): test samples
y_pred ([np.array]): predicted samples Returns:
[float]: R2
""" return r2_score(y_true, y_pred)6. Adjusted R2 Score
Definition:
Adjusted R² measures the proportion of variation explained by only those independent variables that really help in explaining the dependent variable. It penalize for adding independent variable that do not help with the prediction. The only difference between R² and Adjusted R² equation is degree of freedom.
def adj_r2(y_true, y_pred):
"""
Adjusted R2 regression score function. Best possible score is 1.0, lower values are worse. Args:
y_true ([np.array]): test samples
y_pred ([np.array]): predicted samples Returns: [float]: adjusted R2
""" return r2_score(y_true, y_pred) - ((1 - r2_score(y_true, y_pred)) * (len(y_true) - 1) / (len(y_true) - len(y_pred) - 1))7. Mean Absolute Percentage Error
Definition from Wikipedia:
Mean absolute percentage error (MAPE) is a measure of prediction accuracy of a forecasting method. It usually expresses the accuracy as a ratio defined by the formula below:
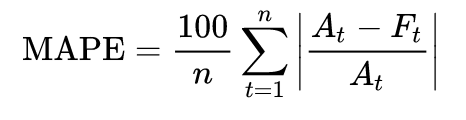
At is the actual value and Ft is the forecast value. The absolute value in this ratio is summed for every forecasted point in time and divided by the number of fitted points n.
def mape(y_true, y_pred):
"""
Mean absolute percentage error regression loss. Args:
y_true ([np.array]): test samples
y_pred ([np.array]): predicted samples Returns:
[float]: mean absolute percentage error
""" return mean_absolute_percentage_error(y_true, y_pred)8. Mean squared logarithmic Error
Definition:
Mean squared logarithmic error (MSLE) can be interpreted as a measure of the ratio between the true and predicted values. It is a variation of MSE and only cares about the percentual difference.
def msle(y_true, y_pred):
"""
Mean squared logarithmic error regression loss. Args:
y_true ([np.array]): test samples
y_pred ([np.array]): predicted samples Returns:
[float]: mean squared logarithmic error
""" return mean_squared_log_error(y_true, y_pred)9. Symmetric mean absolute percentage error
Definition from Wikipedia:
Symmetric mean absolute percentage error (SMAPE ) is an accuracy measure based on percentage (or relative) errors.
Formula:
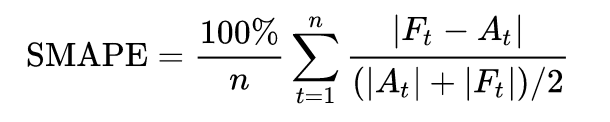
Where At is the actual value and Ft is the forecast value.
def smape(y_true: np.ndarray, y_pred: np.ndarray):
"""
Symmetric mean absolute percentage error regression loss.
    Args:
        y_true ([np.array]): test samples
y_pred ([np.array]): predicted samples Returns:
[float]: SMAPE
""" return np.mean(2.0 * np.abs(y_true - y_pred) / ((np.abs(y_true) + np.abs(y_pred)) + EPSILON))10. Normalized Root Mean Squared Error
Definition:
Normalized Root Mean Square Error (NRMSE) is a fraction of RMSE, which divides the difference of minimum and maximum of observation data.
def nrmse(y_true, y_pred):
    """
    Normalized Root Mean Square Error.
Args:
y_true ([np.array]): test samples
y_pred ([np.array]): predicted samples Returns:
[float]: normalized root mean square error
""" return rmse(y_true, y_pred) / (y_true.max() - y_true.min())Usage
Here are some usage with the functions above, assuming you have already had the actual and predict variables for y.
from regressionmetrics.metrics import *

y_true = [3, 0.5, 2, 7]
y_pred = [2.5, 0.0, 2, -8]


print("R2Score: ",r2(y_true, y_pred))
print("Adjusted_R2_Score:",adj_r2(y_true, y_pred))
print("RMSE:", rmse(y_true, y_pred))
print("MAE:",mae(y_true, y_pred))
print("RMSLE with Neg Value:", rmsle_with_negval(y_true, y_pred))
print("MSE:", mse(y_true, y_pred))
print("MAPE: ", mape(y_true, y_pred))
Thanks for Reading!
If you enjoyed it, please follow me on Medium for more. It’s great cardio for your 👏 AND will help other people see the story.
If you want to continue getting this type of article, you can support me by becoming a Medium subscriber.


