
Building Your First Stock Dashboard with Flask and Python
Welcome to a practical guide where finance meets coding! If you’ve ever been curious about stock market trends or thought about creating your own stock dashboard, this article is tailored for you. We’ll dive into creating a simple yet powerful stock dashboard using Flask, a Python web framework, and yfinance, a library that lets us fetch financial data effortlessly. No prior deep programming or finance knowledge is required—just bring your curiosity and enthusiasm!
Introduction: The Intersection of Coding and Finance
The stock market, with its constant ebb and flow, represents a universe of data that moves with the rhythm of global events, corporate decisions, and investor sentiment. For both seasoned investors and curious enthusiasts, the ability to keep a pulse on this vibrant financial landscape is not just beneficial — it’s crucial. Imagine harnessing the power of programming to bring a vast array of market data to your fingertips, transforming raw numbers into actionable insights. This is where our journey begins: crafting a Flask app that not only displays stock information for selected companies over the last five business days but also marks your foray into the intersecting worlds of finance and web development.
The beauty of this venture lies in its simplicity and the boundless curiosity it caters to. With some basic programming knowledge and an understanding of stock market fundamentals, you can create tools that unveil the market’s complexities in a format that speaks directly to you. The Flask app we’re about to build is not just a project; it’s a testament to the power of coding in unlocking financial insights. It demonstrates how, with a few lines of Python and an intuitive web framework like Flask, you can start building personalized dashboards, analytics tools, or even automated trading systems.

Step-by-Step Actions: Breaking Down Our Project
Understanding Our Tools
- Flask: A lightweight web application framework for Python. Think of it as a set of tools and libraries that help us build web applications easily.
- yfinance: A Python library that allows us to download historical market data from Yahoo Finance, offering a treasure trove of information at our fingertips. As we already mentioned it on few our recent posts, it has the scope of data, that we would need at this stage of our journey. More sophisticated and comprehensive data can be found from other sources, but that’s the story for yet another day.
Preparing the Environment
Before we start coding, ensure you have Python installed on your computer. Then, install Flask and yfinance using pip, Python's package installer, with the commands pip install Flask yfinance in your terminal or command prompt.
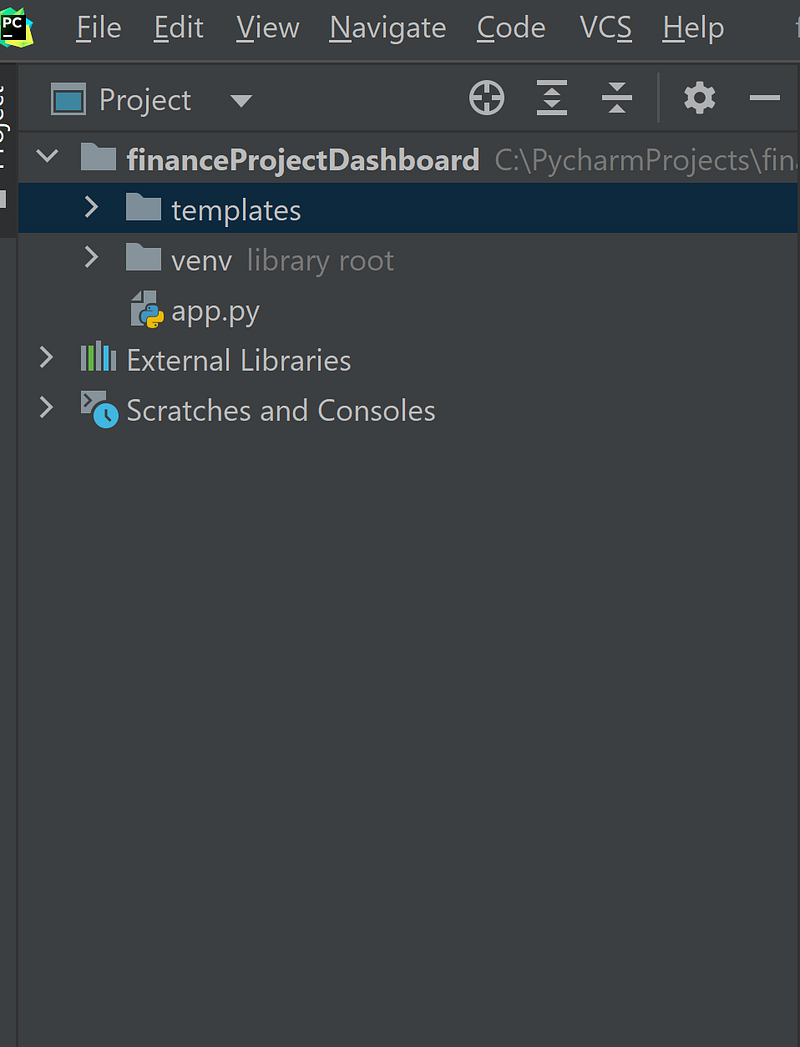
Generally, our project structure will be looking like this:
To have a new project created for Flask, in your IDE (My IDE is Pycharm Pro, 2023), open File->New Project
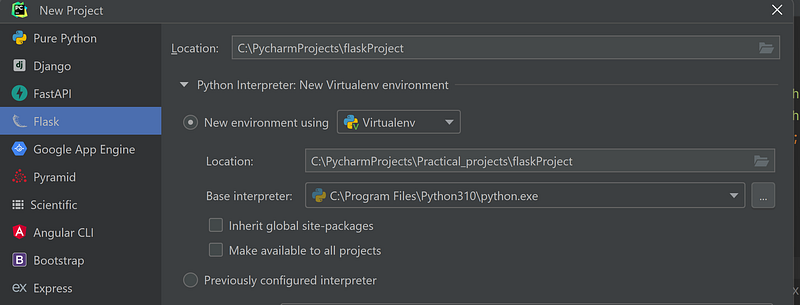
So, our project is created: what’s next?
Fetching Stock Data
Our goal is to display stock data such as the opening, closing, high, and low prices for selected stocks over the last five business days. We use yfinance to fetch this data and Flask to create our web application to display it.
Coding: The Blueprint of Our Application
The core of our application is the app.py file, which sets up the Flask application and defines how to fetch and display the stock data. Here, we're dealing with two main components:
- A function to get stock data for a given symbol and date, using
yfinance. - Flask routes that determine what content is shown on our web page.
We also have an index.html file, which is the template for our web page. It uses a bit of HTML and CSS to structure and style the dashboard, and a little JS to add interactivity between different dates.
First: Imports — Setting the Stage
from flask import Flask, render_template
import yfinance as yf
from datetime import datetime, timedelta, date
import pytz- Flask: A micro web framework for Python, Flask is imported to handle web server operations, routing, and rendering HTML templates. It’s the backbone of our web application, enabling us to create and manage web pages.
- render_template: A Flask function, it allows us to render an HTML template file, passing data from our Python script to the HTML, making dynamic web pages possible.
- yfinance: This library is crucial for fetching financial data. It gives us access to Yahoo Finance’s vast repository of stock information, from historical prices to real-time data.
- datetime, timedelta, date: Imported from Python’s built-in
datetimemodule, these classes are essential for managing dates and times, allowing us to calculate time spans and specific dates. - pytz: This third-party library provides time zone definitions for all time zones worldwide. It’s important for ensuring the dates and times we work with are correctly localized.
Method get_stock_data - Fetching the Numbers
app = Flask(__name__)
def get_stock_data(symbol, date):
    stock = yf.Ticker(symbol)
    tz = pytz.timezone('America/New_York')  # Change to your timezone if not EST
    start_date = datetime.strptime(date, '%Y-%m-%d')
    start_date = tz.localize(start_date)  # Localize to your timezone
    # You want data for one day so you set the start and end date as the same
    hist = stock.history(start=start_date, end=start_date + timedelta(days=1))

    if not hist.empty:
        # Get the last record in the fetched data, which should correspond to your date
        last_row = hist.iloc[-1]
        return {
            'open': round(last_row['Open'], 2),
            'high': round(last_row['High'], 2),
            'low': round(last_row['Low'], 2),
            'close': round(last_row['Close'], 2),
        }
    else:
        return {'open': 'N/A', 'close': 'N/A', 'high': 'N/A', 'low': 'N/A'}
First line initializes a new Flask application. Flask(__name__) creates an instance of the Flask class:
This function is designed to fetch historical stock data for a given symbol (Or symbols) on a specific date. It uses yfinance to retrieve open, high, low, and close prices, among other data points.
- Localizing the Date: The function starts by ensuring the provided date is localized to the Eastern Time Zone, as the New York Stock Exchange operates in this zone. This step prevents potential issues with time zone discrepancies.
- Fetching Data: With
yfinance, it retrieves historical data for the requested day. If the stock market was closed on this day (e.g., weekends or holidays),yfinancewill return an empty DataFrame. - Extracting Data: If data is available, it extracts the open, high, low, and close prices, rounding them to two decimal places for readability.
Method get_last_5_business_days - Scheduling Our Interest
def get_last_5_business_days():
    today = date.today()
    last_5_days = [today - timedelta(days=x) for x in range(1, 8)]
    business_days = [day for day in last_5_days if day.weekday() < 5][:5]
    return business_days
This function calculates the last five business days, excluding weekends, giving us a timeframe for our stock data analysis.
- Calculating Dates: It starts from today’s date, going back up to 7 days to ensure it encompasses at least 5 business days, then filters out weekends.
- Returning Business Days: The last five dates representing the business days are returned, formatted for use in stock data requests.
app.route and method home - displaying results
@app.route('/')
def home():
    dates = get_last_5_business_days()
    date_strings = [date.strftime('%Y-%m-%d') for date in dates]

    stocks_data = {}
    for date_string in date_strings:
        stocks_data[date_string] = {}
        for symbol in ['AAPL', 'GOOGL', 'MSFT']:
            stock_data = get_stock_data(symbol, date_string)
            stocks_data[date_string][symbol] = stock_data

    return render_template('index.html', stocks_data=stocks_data, dates=date_strings)
This segment of code defines the main page of our web application, dictating what happens when a user visits the homepage.
- Routing: The
@app.route('/')decorator tells Flask that this function should be called when the root URL of the web app is accessed. - Data Preparation: Inside the function, it fetches stock data for the last five business days for predefined stock symbols, organizing this data to be displayed on the web page. As you can see above, we chose to get data for 3 different stocks: Apple, Google and Microsoft.
- Rendering the Page: Finally, it calls
render_templateto render theindex.htmltemplate, passing the collected stock data and the dates to the template.
That’s it? Seems so — at least, we got all the code in 1 piece getting information and sorting it based on our preferences.
Did we missed something? Yes — we do not have yet where it is displayed. For that — we will need to have html page, which will contain all our data gathered. We need to have a page in templates folder (that one is created when Flask app is created). So, we’re right clicking on templates folder and creating a new html file (name it anything you like — I liked the word index)
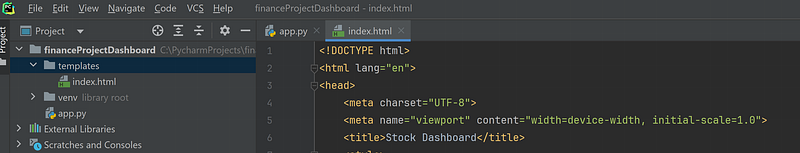
<!DOCTYPE html>
<html lang="en">
<head>
    <meta charset="UTF-8">
    <meta name="viewport" content="width=device-width, initial-scale=1.0">
    <title>Stock Dashboard</title>
    <style>
        body { font-family: Arial, sans-serif; }
        .tab-content { display: none; }
        .tab-content.active { display: block; }
        #tabs button.active { background-color: #4CAF50; color: white; }
        #tabs button { background-color: #f1f1f1; color: black; padding: 10px 20px; border: none; cursor: pointer; }
        #tabs button:hover { background-color: #ddd; }
        table { width: 100%; border-collapse: collapse; }
        th, td { text-align: left; padding: 8px; }
        th { background-color: #f2f2f2; }
        tr:nth-child(even) { background-color: #f9f9f9; }
        .increase { background-color: #4CAF50; color: white; }
        .decrease { background-color: #f44336; color: white; }
        .same { background-color: #f9f9f9; color: black; }
    </style>
</head>
The initial section sets up the basic HTML document structure, including the character encoding (UTF-8), viewport settings for responsive design, and the title of the webpage.
Styling with CSS
Within the <head>, a <style> tag contains CSS rules defining the appearance of our stock dashboard:
- General Styling: Sets the font and defines styles for the tabs and table to make the dashboard visually appealing and user-friendly.
- Tabs and Buttons: Styles for the interactive tabs that allow users to switch between different dates to view stock data.
- Table Styling: Ensures that the table displaying stock information is readable, with alternating row colors for better distinction.
- Color-Coding: Classes like
.increase,.decrease, and.sameare prepared for potentially color-coding stock trends, though the actual logic for determining the trend isn't implemented in the Python code provided.
<body>

<div id="tabs">
    {% for date in dates %}
        <!-- Use `loop.index0` here for zero-based index -->
        <button class="tablinks" onclick="openTab(event, 'date-{{ loop.index0 }}')">{{ date }}</button>
    {% endfor %}
</div>

{% for date in dates %}
    <!-- Use `loop.index0` here for zero-based index -->
    <div id="date-{{ loop.index0 }}" class="tab-content">
        <h3>{{ date }}</h3>
        <table>
            <thead>
                <tr>
                    <th>Symbol</th>
                    <th>Open</th>
                    <th>Close</th>
                    <th>High</th>
                    <th>Low</th>
                </tr>
            </thead>
            <tbody>
                {% for symbol, data in stocks_data[date].items() %}
                    <tr class="{{ data.trend }}">
                        <td>{{ symbol }}</td>
                        <td>{{ data.open }}</td>
                        <td>{{ data.close }}</td>
                        <td>{{ data.high }}</td>
                        <td>{{ data.low }}</td>
                    </tr>
                {% endfor %}
            </tbody>
        </table>
    </div>
{% endfor %}
Body: Displaying the Dashboard
The <body> contains the dynamic part of the dashboard:
- Tabs for Dates: Uses a loop (
{% for date in dates %}) to generate a button for each of the last five business days. Each button, when clicked, shows the corresponding date's stock data. - Stock Data Tables: Another loop generates a table for each date, populated with stock data (open, close, high, low prices) for selected symbols. This part of the template uses Flask’s template syntax to insert data passed from the
app.pyscript.
Interactive Tabs with JavaScript
<script>
function openTab(evt, tabName) {
    var i, tabcontent, tablinks;
    tabcontent = document.getElementsByClassName("tab-content");
    for (i = 0; i < tabcontent.length; i++) {
        tabcontent[i].style.display = "none";
    }
    tablinks = document.getElementsByClassName("tablinks");
    for (i = 0; i < tablinks.length; i++) {
        tablinks[i].className = tablinks[i].className.replace(" active", "");
    }
    document.getElementById(tabName).style.display = "block";
    evt.currentTarget.className += " active";
}

// Automatically open the first tab on page load
window.onload = function() {
    document.getElementsByClassName("tablinks")[0].click();
};

</script>

</body>
</html>
At the bottom of the <body>, a <script> tag contains JavaScript to make the tabs interactive:
- Function
openTab: Hides all tab content by default and shows the content for the tab that was clicked. It also highlights the active tab. - Auto-Open the First Tab: A small script ensures that the first tab is automatically opened when the page loads, making the dashboard immediately useful to the visitor.
Now when the magic is done… Let’s see how we are going to have it all seen.
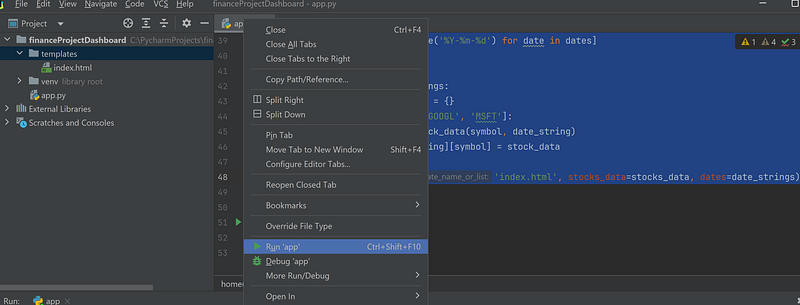
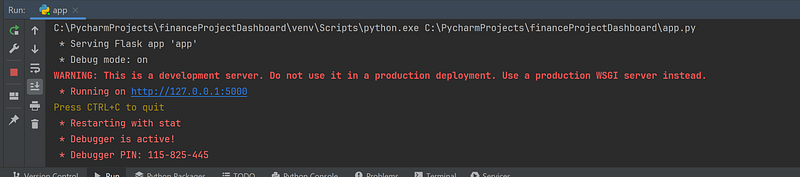
If everything is done correctly, after running the app, in the console we can see that app is running
And to complete, let’s open the browser and see how our page is looking
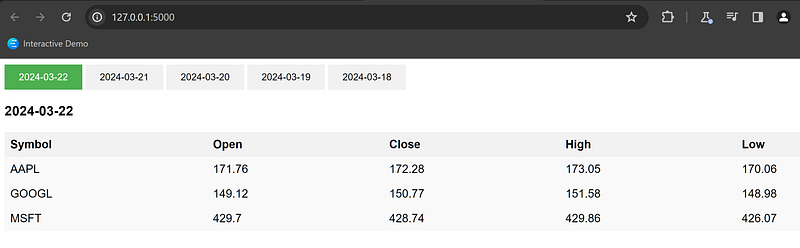
Clicking on different dates, we can get the actual data for the selected time for those stocks, that we chose.
Conclusion: Empowering Your Finance Journey with Code
Congratulations! You’ve just taken a significant first step into blending coding with finance. This stock dashboard, albeit simple, opens up myriad possibilities for further exploration and customization. Whether you’re interested in adding more stocks, incorporating additional financial metrics, or even applying machine learning models to predict future trends, the foundation is now set.
Embracing Continuous Learning
The journey doesn’t stop here. Consider diving deeper into Flask to enhance your web application or exploring other financial libraries and APIs to enrich your dashboard with more data. The intersection of finance and coding is vast and rich with opportunity. Code and invest carefully.
Remember, the most profound learning comes from doing. By experimenting with code and financial concepts, you’re not only building useful tools but also gaining invaluable insights into the mechanics of the market. Happy coding, and may investments (both: your time and your money) be ever in your favor!
In Plain English 🚀
Thank you for being a part of the In Plain English community! Before you go:
- Be sure to clap and follow the writer ️👏️️
- Follow us: X | LinkedIn | YouTube | Discord | Newsletter
- Visit our other platforms: Stackademic | CoFeed | Venture | Cubed
- More content at PlainEnglish.io


