
Building Post Marketing Surveillance for Life Sciences using Generative AI (GenAI) and Large Language Models (LLMs)
Problem Statement
I had the privilege to work with some of my Life Sciences friends to discuss and build post marketing surveillance POC which can help and detect continuous efficiency, safety and effectiveness of newly release drug to the market. The POC was conducted more as an “art of possible” with the intention to show and discuss how Generative AI and Large Language Models (LLMs) can help solve this space.
I am not an expert in Life Sciences, but with my background in data, analytics, ML, GenAI and LLM’s , I took up the challenge and tried to solve the pieces of puzzle one at a time.
The most amazing moment for me was when I discovered that underneath the Life Sciences use cases and capabilities needed to solve for the Post Marketing Surveillance, 80% of the work was very technology focussed and less domain specific. Hence, all my previous capabilities, features and building blocks that I have discussed in my 40+ blogs till now were all valid and I could easily build the POC using my existing code and capabilities that I worked on. (re-usability pays off)
As a part of this journey, let me take you through the technical process and I will also point out which pieces are reusable which I have talked about in detail previously.
Solution
First things first. What Separates a post marketing surveillance use case from other use cases are the datasets. I had to research and discuss in details to get an understanding of what are the dimensions (pillars) of post marketing surveillance are and what datasets are critical to measure each of the dimensions.
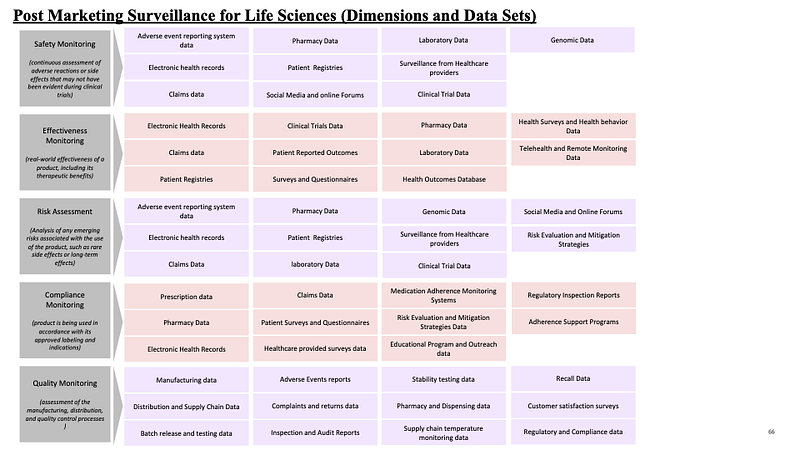
Overall, post marketing surveillance process can be captures by measure 5 dimensions:
- Safety Monitoring — that provides continuous assessment of adverse reactions or side effects that may not have been evident during clinical trial.
- Effectiveness Monitoring — provides real world effectiveness of product including therapeutic benefits.
- Risk Assessment — analysis of any emerging ricks associated with the use of product such as rare side effects or long term effects.
- Compliance Monitoring — assessment that the product is being used in accordance with approved labelling and indications.
- Quality Monitoring — assessment of the manufacturing, distribution and quality control processes.
Now, let us take a look into the data sets needed for the above 5 dimensions.
- For Safety Monitoring — we can focus on datasets like — adverse event reporting system data; electronic health records data; claims data; pharmacy data; patient registries; social media and online forums; laboratory data; surveillance from healthcare provider data; clinical trial data; genomic data etc.
- For Effectiveness monitoring — we can focus on electronic health records; claims data; patient registries; clinical trials data; patient reported outcomes data; surveys and questionnaires data; pharmacy data; laboratory data; health outcomes database; health surveys and health behavior data; tele-health and remote monitoring data etc.
- For risk management — we can focus on collecting adverse events reporting systems data; electronic health reports; claims data; pharmacy data; patient registries data; laboratory data; genomic data; surveillance from healthcare provider data; clinical trial data; social media and online forums data; risk evaluation and migration data etc.
- From Compliance monitoring — we can get access to prescription data; pharmacy data; electronic health records data claims data; patient surveys and questionnaires data; healthcare provided surveys data; medication adherence monitoring systems data; risk evaluation and mitigation strategies data; educational program and outreach data; regulatory and inspection reports; adherence support programs data etc.
- For quality monitoring- we can focus on manufacturing data; distribution and supply chain data; batch and testing data; adverse events reports data complaints and returns data; inspection and audit reports data; stability and testing data; pharmacy and dispensing data; supply chain temperature monitoring data; recall data; customer satisfaction data; regulatory and compliance data etc.
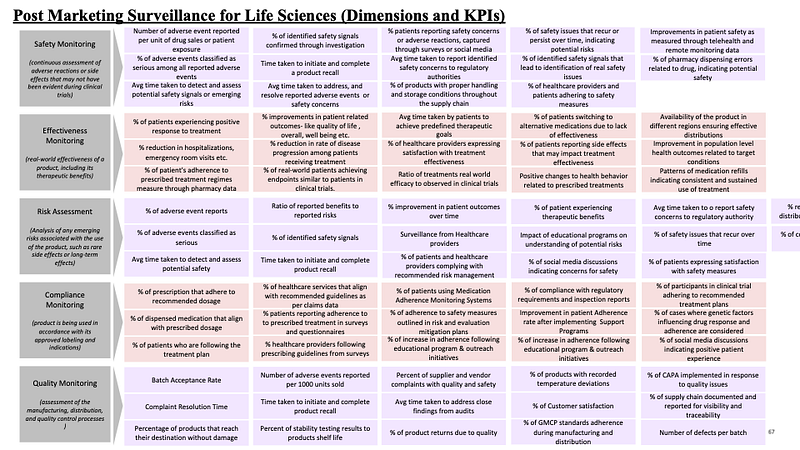
Next, let us focus on the key KPI’s we need to extract from these datasets associated with each dimension.
- For Safety monitoring — we should extract KPIs like — number fo adverse events reported; percent of adverse events classified; avg time taken to detect and assess potential safety signals; percent of identified safety signals confirmed; time taken to initiate and complete product recall; avg time taken to address and resolve adverse events etc; percent of patients reporting safety concerns for adverse reactions etc; avg time taken to report identified safety concerns to regulatory authority; percent of products with proper handling and storage conditions throughout the supply chain; percent of safety issues that recur or persist over time including potential risks; percent of identified safety signals that lead to identification of real safety issues; percent of healthcare providers and patients adhering to safety measures; improvements in patient safety ; percent of pharmacy dispersing errors related to drug etc.
- For the effectiveness measure — we can focus on KPIs like — percent of patients experiencing positive response to treatment; percent of reduction in hospitalization etc; percent of patient adherence to prescribed treatment etc; percent of improvement in patient related outcomes etc; percent of reduction in rate of disease progression among patients; percent of real-world patients achieving endpoints similar to patients in clinical trials etc; avg time taken by patients to achieve predefined therapeutic goals; percent of healthcare providers expressing satisfaction with treatment effectiveness; ratio of treatments in real-world efficacy to observed in clinical trials; percent of patients switching to alternative medications due to lack of effectiveness; positive changes to health behavior related to prescribed treatments; availability of the product in different regions ensuring effective distributions; improvement in population level heath etc; patterns of medication refills etc.
- For Risk Assessment — we can focus on KPI’s like — percent of adverse event reports; percent of adverse events classified as serious; avg time taken to detect and assess potential safety; ratio of reported benefits to reported risks; percent of identified safety signals; time taken to initiate and complete product recall; percent of improvements in patient outcomes; surveillance from healthcare providers; percent of patients and healthcare providers complying with recommended risk management; percent of patient experiencing therapeutic benefits; percent of social media discussions indicating concerns for safety; avg time taken to report safety concerns to regulatory authority; percent of safety issues that recur over time; percent of patients expressing satisfaction with safety measures;
- For Compliance Monitoring — we can focus on KPIs like — percent of prescriptions that adhere to recommended dosage; percent of dispensed medication that align with prescribed dosage; percent of patients who are following the treatment plan; percent of healthcare services that align with recommended guidelines as per claims data; percent of patients reporting adherence to prescribed treatment in surveys etc; percent of healthcare providers following prescribed guidelines; percent of patients using medication adherence monitoring system; percent of adherence to safety measures outlines in risk and evaluation mitigation plan; percent of increase in adherence following educational program outreach; percent of compliance with regulatory requirements and inspection reports; improvements in patient adherence rate after implementing support programs; percent of participants in clinical trial adhering to recommended treatments; percent of cases where generic factors influencing drug response are considered; percent of social media discussions indicating positive patient experience etc.
- For quality monitoring — we can use KPI’s like — batch acceptance rate; complaint resolution time; percentage of products that reach their destination without damage; number of adverse events reported per 1000 units sold; time taken to initiate and complete product recall; percent of stability testing results to products shelf life; percent of supplier and vendor complaints with quality and safety; avg time taken to address close findings from results; percent of product returns due to quality; percent of products with recorded temperature deviations; percent of customer satisfaction; percent of GMCP standards adherence during manufacturing and distribution; percent of CAPA implementation in response to quality issues; percent of supply chain documents and reports for visibility and traceability; number of defects per batch etc.
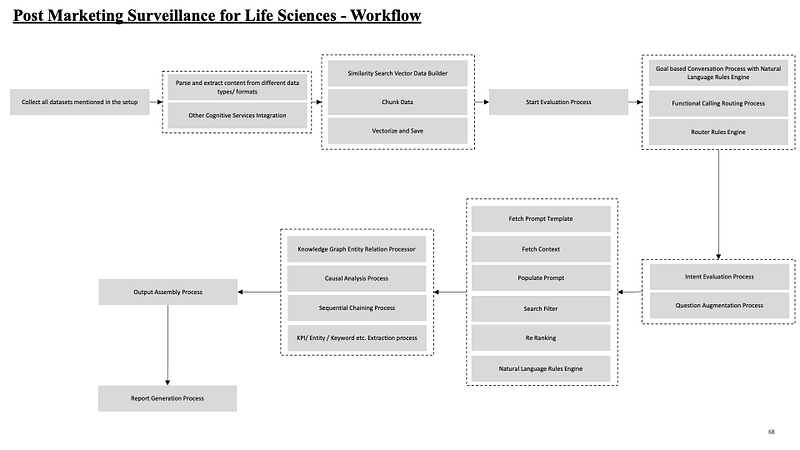
Finally, lets look into the process flow. This is based on the other blogs where I have explained in details each of the building blocks.
The journey starts with collection of datasets from above. Once we get the data- we can parse and extract content and with the help of other cognitive services to build the data, chunk and save data into the central knowledge repository.
Once the process starts, we can start with goal based conversational process and route the request to the right module, from there we can evaluate the intent and augment the question for best response. Then the control goes to the prompt management process where we select, build and generate the prompt to extract relationships, perform causal analysis, sequential chaining etc to call the LLM and generate the response.
Conclusion
The idea is to start the post marketing surveillance as a more automated process. This is just the start. I will keep updating this blog with more details. Do reach out or drop a note to ask more questions and have follow ups.
Till next blog…
