
Building a Low-Latency Fitness Leaderboard with Apache Pinot
Use Apache Pinot to ingest fitness band events from a Kafka topic and make them available for immediate querying from a leaderboard web app.

Analytics for the masses, is that a joke?
Back in the day, analytics and BI has been restricted for the power users of an organization. Only a handful of analysts, managers, and data scientists had the chance of playing around with expensive analytics and BI toolsets.
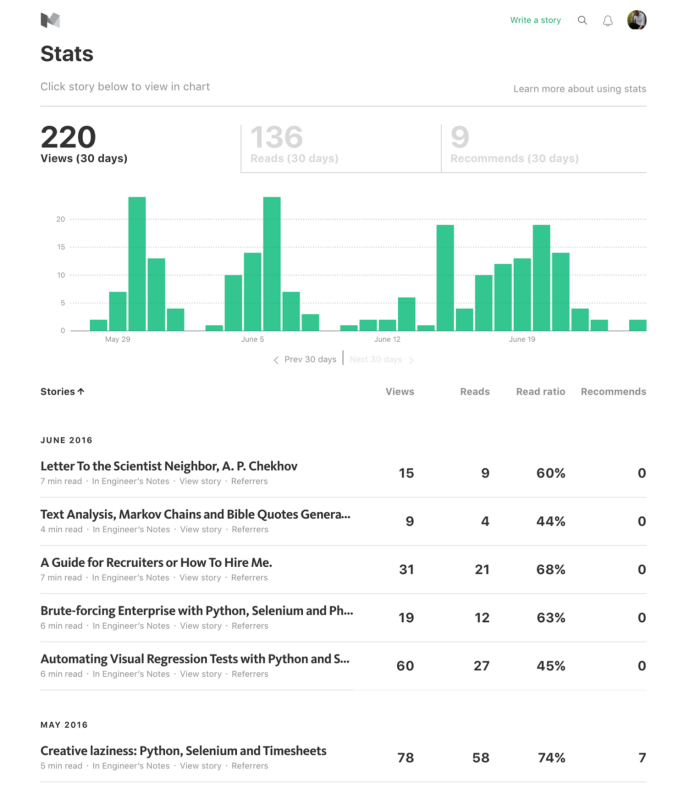
Today, we see many businesses have started to expose a rich set of analytics directly to their end-users. For example, Internet-scale companies like LinkedIn does that with the “Who viewed your profile” feature. Twitter provides analysis for your tweets, Writing platforms like Medium provides analytics on your content.
When you take your analytical tools and expose them directly to the end-user of your product, it is called user-facing analytics or site-facing analytics. Many businesses have already started jumping on that bandwagon. This article discusses how Apache Pinot helps you build low-latency, high-throughput analytics for your end-users.
Why user-facing analytics is hard
Let me take a realistic example to understand this better.
Imagine a company that sells fitness bands, along with a companion mobile app that provides a real-time summary of user’s fitness activities.
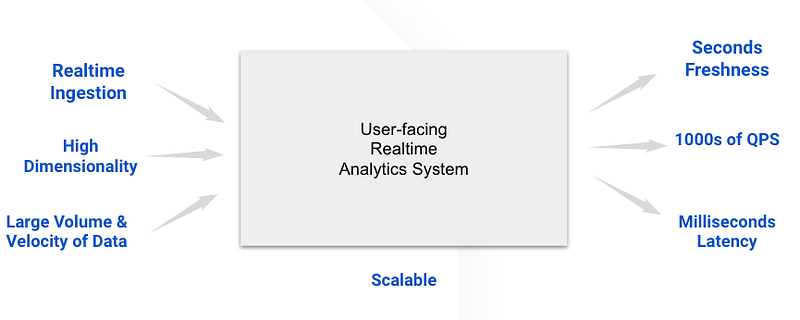
Whenever users launch the mobile app, it will spawn 100s of 1000s of queries per second (QPS) at the backend to fetch their fitness summaries. It’s not just a few analysts doing offline analysis or a handful of data scientists in a company running ad-hoc queries. That is ALL end-users receiving personalized analytics on personal devices.
So the app needs to scale as much as the active users on that app (think millions of events/sec). The query latency must be within the sub-second range to ensure a good user experience. The freshness of the data matters as well; users immediately want to see how good their workout is by comparing it with all the users on the platform.
Building a system that caters to the above is challenging and demands an army of distributed systems engineers.
Apache Pinot as a solution
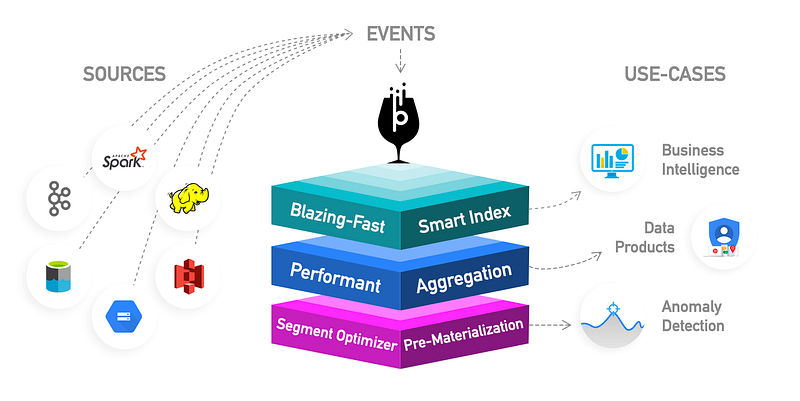
Apache Pinot is a distributed OLAP store that can ingest data from various sources such as Kafka, HDFS, S3, GCS, and so on and make it available for querying in real-time. It also features a variety of intelligent indexing techniques and pre-aggregation techniques for low latency.
Under the covers, it features columnar storage with intelligent indexing techniques and pre-aggregation techniques. Thus, making Pinot an ideal choice for real-time, low-latency OLAP workloads. For example, BI dashboards, fraud detection, and ad-hoc data analysis are few use cases where Pinot excels.
In this post, I’m not going to dive deeper into Pinot’s architecture and capabilities. Instead, I will help you learn the basics of Pinot by taking you through a practical scenario. If you are looking for a deep dive, Pinot documentation is resourceful.
Let’s see what we are going to build.
The fitness band app
Let’s retake our previous fitness band example.
Assume that fitness band does only one thing. That is, it logs the number of steps walked by the user who owns it. After completing a walk or run, the band emits a JSON event to the backend that looks like below.
{
"userId":7727,
"userName":"pmatasov0",
"country":"Philippines",
"gender":"Female",
"steps":13492,
"loggedAt":"1626235471"
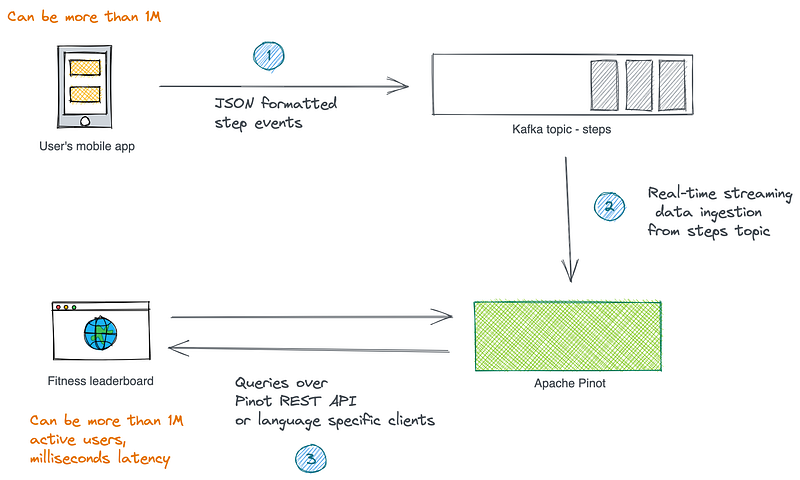
}The event format is self-explanatory. The backend then receives the event can stores them in a Kafka topic.
Our goal is to build a web-based leaderboard that shows the following information to the app’s entire user base, which can be more than a million.
- The top then users have logged the most number of steps during the last 24 hours.
- The top 10 users with all-time high step count.
Now we have a few challenges here. First, the events are in the Kafka topic, which is not in a format ready for querying. Once they are ready, we need to write queries that respond within milliseconds duration.
The overall solution looks like below. Let’s not focus much on the event publication and leaderboard rendering parts in the scope of this post. I would say those are boring problems. The challenging part here is coming up with the above metrics.
Let’s get started.
The implementation of the leaderboard queries
First, we will set up a single node Pinot cluster in our local workstation. Then create required Pinot artifacts to ingest data from the Kafka topic. Finally, we will write the queries that power the leaderboards and see how we can use Pinot REST APIs to query them from a UI.
Impatient readers can find the source code from here.
1. Setting up Pinot
Pinot may be deployed to and operated on a cloud provider or a local or virtual machine. Follow this guide to download and install the latest Pinot distribution locally.
A typical Pinot cluster has multiple distributed system components: Controller, Broker, Server, and Minion. In production, they are deployed independently for scalability. But for our small experiment, let’s spin up a Pinot instance that bundles all the above components together.
Execute the following from the Pinot home directory.
bin/quick-start-streaming.sh
2. Create a Kafka topic to hold step counts
The following command brings up a single node Kafka server, which runs on port 9876. Execute it from the same location.
bin/pinot-admin.sh StartKafka -zkAddress=localhost:2123/kafka -port 9876Use the Kafka tools to create a topic called steps.
kafka-topics --create \
--bootstrap-server localhost:9876 \
--replication-factor 1 \
--partitions 1 \
--topic steps
3. Create a schema and a table
Now, it’s time to get our user steps data into Pinot. For that, we need to create a real-time table in Pinot so that it can ingest data from the Kafka topic above.
First, we need to create a Schema to define the columns and data types of the Pinot table. In a typical schema, we can categorize columns as follows.
- Dimensions: Typically used in filters and group by clauses for slicing and dicing into data.
- Metrics: Typically used in aggregations, represents the quantitative data.
- Time: Optional column represents the timestamp associated with each row.
Let’s create a schema file as follows and call it steps-schema.json
With our schema in place, let’s create a real-time table to hold the ingested data. Name the file as steps-table.json
Now that we have our table and schema, let’s upload them to the cluster. As soon as the realtime table is created, it will begin ingesting from the Kafka topic.
bin/pinot-admin.sh AddTable \
-schemaFile /tmp/fitness-leaderboard/steps-schema.json \
-tableConfigFile /tmp/fitness-leaderboard/steps-table.json \
-exec
If everything goes as planned, the above returns an output like this:
{"status":"Table steps_REALTIME succesfully added"}4. Publish some sample events to Kafka topic
Publish some sample data into our Kafka topic to simulate a few users in the system. You can find a sample data file in the source code repository.
kafka-console-producer \ --broker-list localhost:9876
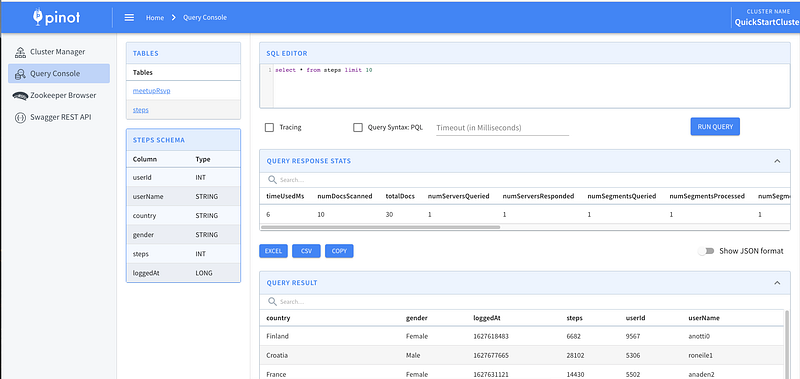
--topic steps < fitness_events_24h.jsonThe beauty of Pinot is that as soon as data flows into the stream, the Pinot table will consume it, and it will be ready for querying. You can use the integrated Query Console to interact with data in the steps table.
5. Write queries that power the leaderboards
Now that we have our data in Pinot. Let’s write the queries required for computing the results that would go into the leaderboards. Pinot uses Calcite SQL Parser to parse queries and uses MYSQL_ANSI dialect. You can find more examples here.
One limitation of Pinot is the lack of support for joins or nested subqueries that span multiple tables. There’s strong reasoning behind that. But we are not going to need any joins in our example.
Top 10 users in the last 24 hours
Type in the following query into the query console and see the results. Here, we are using a DateTimeFunction to filter out the records that are older than 24 hours.
select userName, country, sum(steps) as total
from steps
where loggedAt > ToEpochSeconds(now()- 86400000)
group by userName, country
order by total desc
Top 10 users with all-time high steps
The following query returns the top 10 users with all-time high step counts.
select userName, country, sum(steps) as total
from steps
group by userName, country
order by total desc
limit 10
6. Executing queries from the leaderboard UI
Now the remaining task is to execute the above queries from the leaderboard application UI.
To programmatically query Pinot, we can use Pinot REST API, which can be accessed by invoking POST operation with a JSON body containing the parameter sql to the /query/sql endpoint on a broker.
The following fetches the top 10 users with all-time high step counts. In our example, broker port is 8000.
curl -H "Content-Type: application/json" -X POST \
-d '{"sql":"select userName, country, sum(steps) as total from steps group by userName,country order by total desc limit 10"}' \
http://localhost:8000/query/sql
The output would look like this:

The web application that implements the leaderboard can invoke these REST API to fetch data on-demand. For developers who prefer to query Pinot with typed languages, Pinot provides language-specific clients as well. Current support includes JDBC, Java, Python, and Go.
Conclusion
In this simple example, you learned to use Apache Pinot to built a low-latency, high-throughput user-facing analytics use case. I barely scratched the surface here. Pinot is capable of doing much more than that.
Once you are familiar with the basics, head over to the documentation and see how batch and streaming ingestion works under the hood. Also, there are few exciting things. Check out the Pinot integration with a Superset and working with ThirdEye for fraud detection.
Visit here to learn more about Apache Pinot and try out Pinot recipes.
References
Building Latency Sensitive User Facing Analytics via Apache Pinot — Chinmay Soman