
Building a Log Analysis Data Pipeline Using Kafka, Elasticsearch, Logstash, and Kibana — ELK
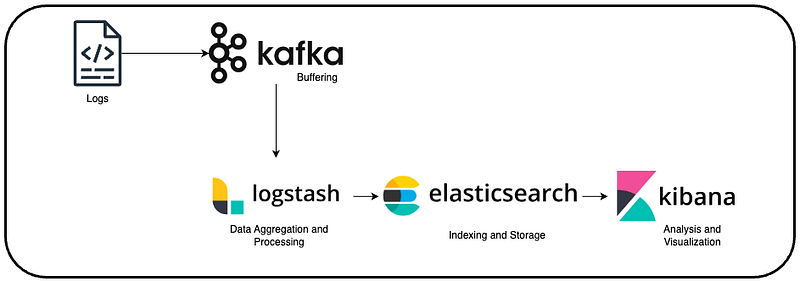
When it comes to analyzing logs, having a real-time, centralized, and automated solution is a game changer. Instead of sifting through individual log files on multiple servers, you can use a log analysis pipeline to ingest, store, and visualize logs in real-time. In this guide, we’ll build such a pipeline using Kafka, Logstash, Elasticsearch, and Kibana, which are often referred to together as the “ELK stack” (plus Kafka).
But first, let’s take a closer look at what each component in this pipeline does:
Key Components of the Pipeline
- Kafka: Think of Kafka as the message bus or real-time log aggregator. It’s responsible for collecting log data from multiple sources and streaming it to other components in the pipeline.
Learn more about Kafka here:
- Logstash: Logstash acts as a processor that ingests the logs from Kafka, transforms the data into a readable format, and sends it to Elasticsearch.
- Elasticsearch: This is where logs are stored, indexed, and made searchable. Elasticsearch is a distributed search engine that’s optimized for fast searches and powerful querying.
- Kibana: Kibana is the dashboard and visualization tool. It connects with Elasticsearch to visualize the log data, allowing you to search, filter, and create real-time dashboards for easy monitoring.
What does the ELK stack do?
The ELK stack is used to solve a wide range of problems, including log analytics, document search, security information and event management (SIEM), and observability. It provides the search and analytics engine, data ingestion, and visualization.
Now that you know what each piece does, let’s walk through the setup step by step!
Step-by-Step Setup
Step 1: Setting Up Kafka
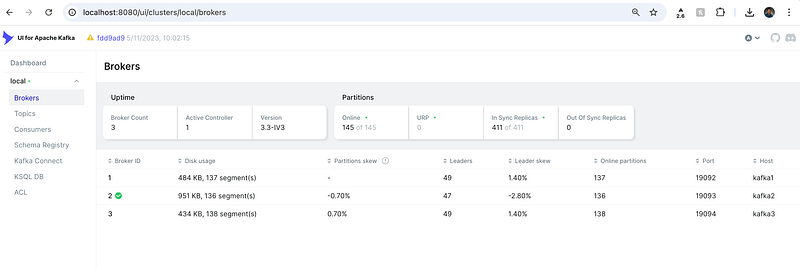
Kafka will handle log collection by streaming log data to our other services.
Follow the steps from my previous article to setup a Multinode Kafka Cluster on Docker:
Step 2: Setting up ELK Stack
Docker Compose file that will set up Elasticsearch, Logstash, and Kibana together.
You can also use the official website to set up Kibana and Elasticsearch:
Step 2.1: Create a docker-compose.yml File:
Create a new file called docker-compose.yml and paste the following configuration inside:
version: '3'
services:

  elasticsearch:
    image: docker.elastic.co/elasticsearch/elasticsearch:7.10.0
    environment:
      - "discovery.type=single-node"
      - "cluster.name=docker-cluster"
    ports:
      - "9200:9200"
    networks:
      - elk
    volumes:
      - elasticsearch-data:/usr/share/elasticsearch/data

  logstash:
    image: docker.elastic.co/logstash/logstash:7.10.0
    ports:
      - "5044:5044"
      - "9600:9600"
    volumes:
      - ./logstash.conf:/usr/share/logstash/pipeline/logstash.conf
    depends_on:
      - elasticsearch
    networks:
      - elk
    environment:
      - LS_JAVA_OPTS=-Xmx1g -Xms1g

  kibana:
    image: docker.elastic.co/kibana/kibana:7.10.0
    ports:
      - "5601:5601"
    depends_on:
      - elasticsearch
    networks:
      - elk
    environment:
      - ELASTICSEARCH_URL=http://elasticsearch:9200

networks:
  elk:
    driver: bridge

volumes:
  elasticsearch-data: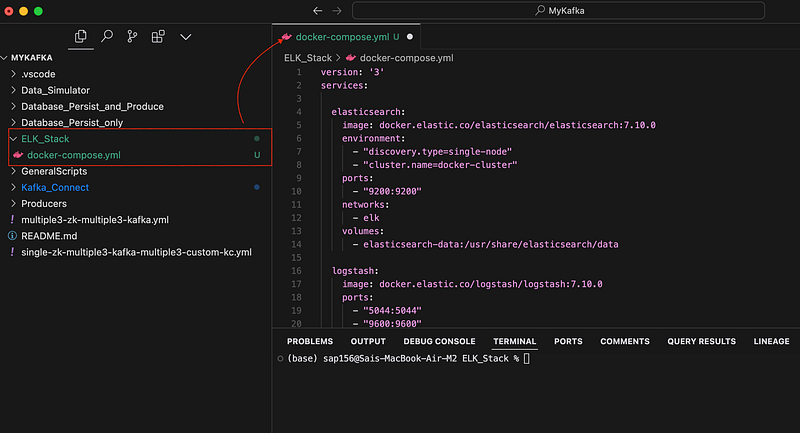
docker-compose.ymlStep 2.2: Logstash Configuration to Pull from Kafka
You’ll also need a logstash.conf file to configure Logstash to pull logs from your Kafka setup:
input {
  kafka {
    bootstrap_servers => "kafka1:19092,kafka2:19093,kafka3:19094"
    topics => ["logs"]
    group_id => "log-consumer-group"
  }
}

output {
  elasticsearch {
    hosts => ["http://elasticsearch:9200"]
    index => "logs-%{+YYYY.MM.dd}"
  }
}
Input Section:
- This section configures Logstash to receive input from Kafka.
- It specifies three Kafka brokers (kafka1, kafka2, kafka3) with their respective ports.
- It’s set to consume from a Kafka topic named “logs”.
- The group_id is set to “log-consumer-group”, which helps manage consumer offsets in Kafka.
Output Section:
- This section configures where Logstash should send the processed data.
- It’s set to output to Elasticsearch.
- The Elasticsearch host is specified as “http://elasticsearch:9200".
- The index name is dynamic, using the pattern “logs-YYYY.MM.dd”, which creates daily indices (e.g., logs-2024.09.10).
This configuration creates a pipeline where Logstash consumes log messages from a Kafka topic and then sends them to Elasticsearch, organizing them into daily indices for easy management and querying.
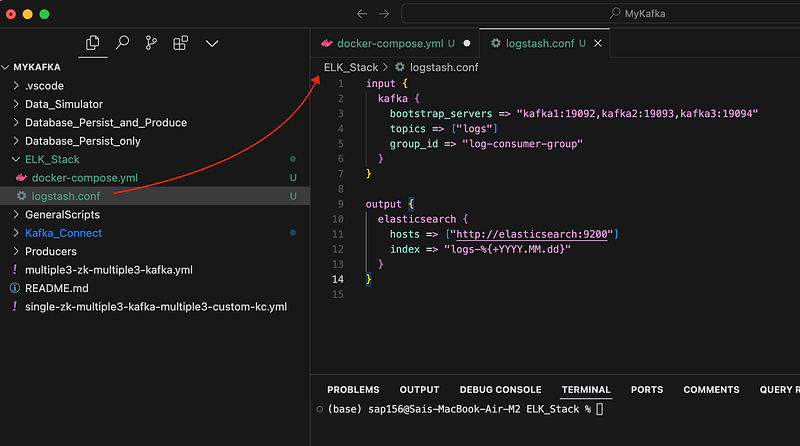
logstash.confStep 2.3: Running the Stack
Now, place both the docker-compose.yml and logstash.conf files in the same directory. Then, you can start the ELK stack with:
docker-compose up -d
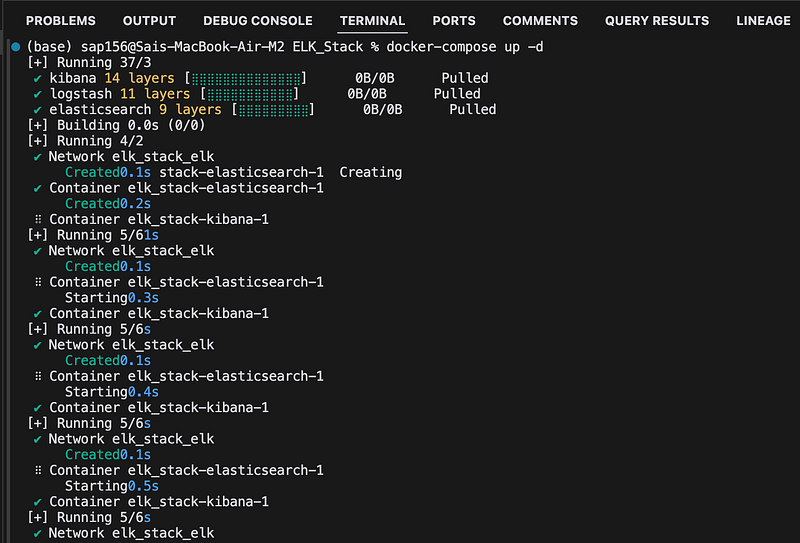
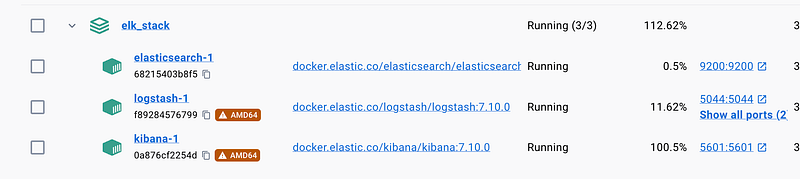
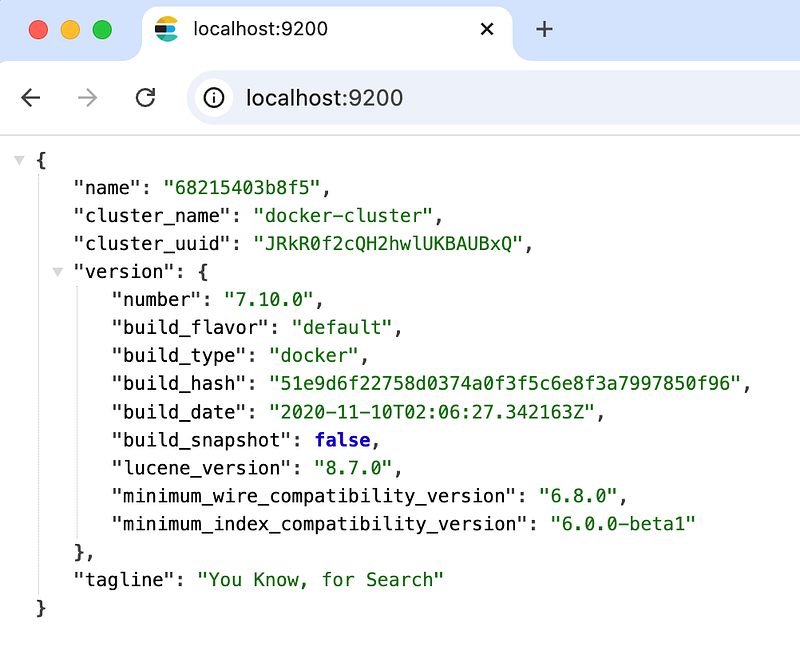
You can confirm if Elasticsearch is running by visiting http://localhost:9200. A JSON response means it’s working!
Kibana’s UI will be available at http://localhost:5601. This is where we’ll visualize the log data.
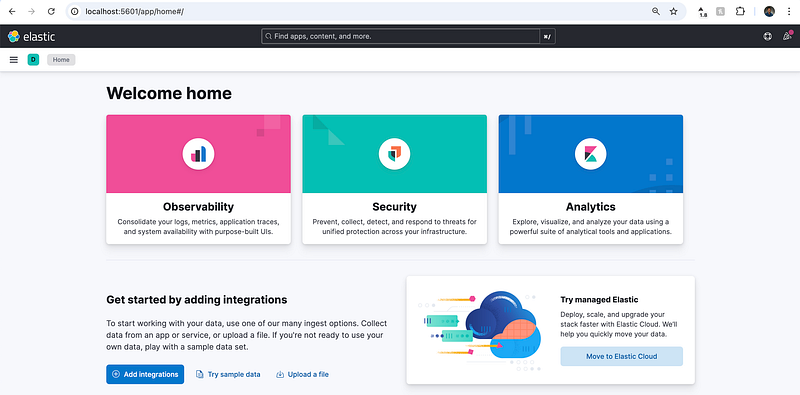
Step 3: Generate Fake Logs and Send to Kafka
Here’s a Python script that will generate fake logs and push them to Kafka:
from kafka import KafkaProducer
import json
import random
import time

producer = KafkaProducer(bootstrap_servers=['localhost:9092'],
                         value_serializer=lambda v: json.dumps(v).encode('utf-8'))

log_levels = ['INFO', 'WARNING', 'ERROR', 'DEBUG']

def generate_log():
    return {
        'timestamp': time.time(),
        'level': random.choice(log_levels),
        'message': 'This is a test log message',
        'service': 'auth-service'
    }

while True:
    log = generate_log()
    print(f'Sending log: {log}')
    producer.send('logs', log)
    time.sleep(1)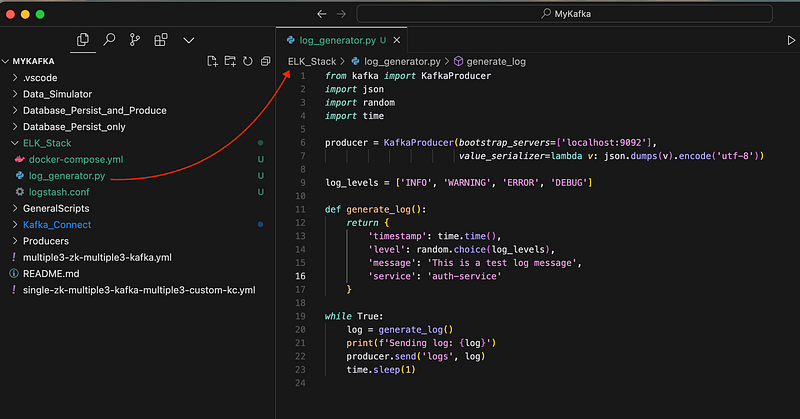
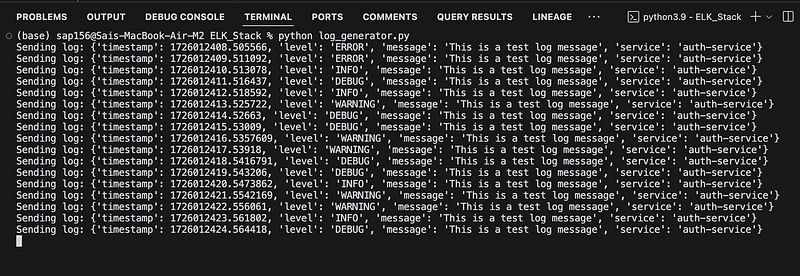
python log_generator.py
This script will generate logs and send them to your Kafka brokers. Logstash will pull the logs from Kafka and push them to Elasticsearch, and you can visualize them in Kibana.
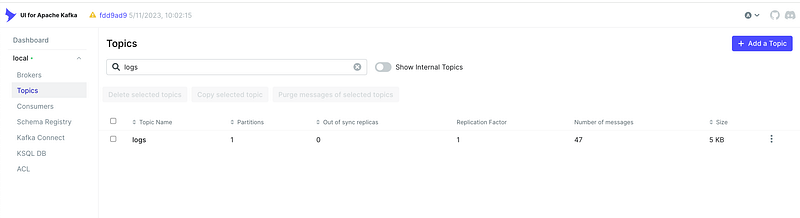
You can verify if the generated logs are sent to the Kafka topic ‘logs’ on the Kafka UI:
You can view the messages in the Kafka logs topic on the Kafka UI as well:
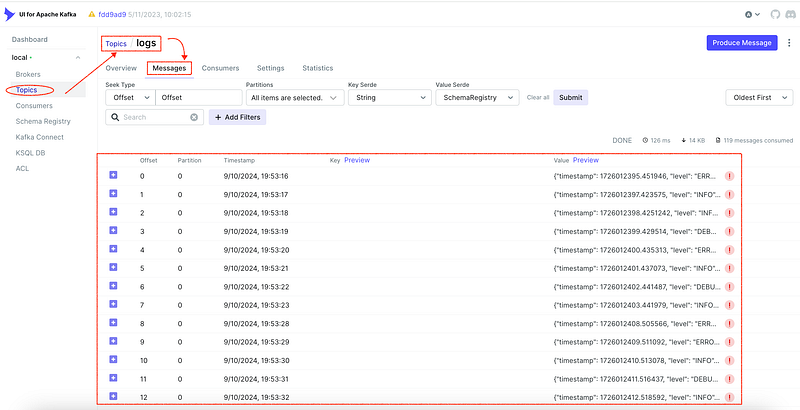
Awesome! Since you have everything running, now it’s time to visualize your logs in Elasticsearch and Kibana. Here’s how you can proceed:
Step 4: Access Kibana
Kibana provides a powerful UI for visualizing data stored in Elasticsearch. You can access it by navigating to http://localhost:5601 in your browser.
Step 5: Set Up an Index Pattern in Kibana
To visualize the logs from Elasticsearch, you need to set up an index pattern in Kibana that matches the logs being ingested.
- Click on the “Management” option: On the right-side panel of the Kibana home page, you should see a “Management” tab. Click on it.
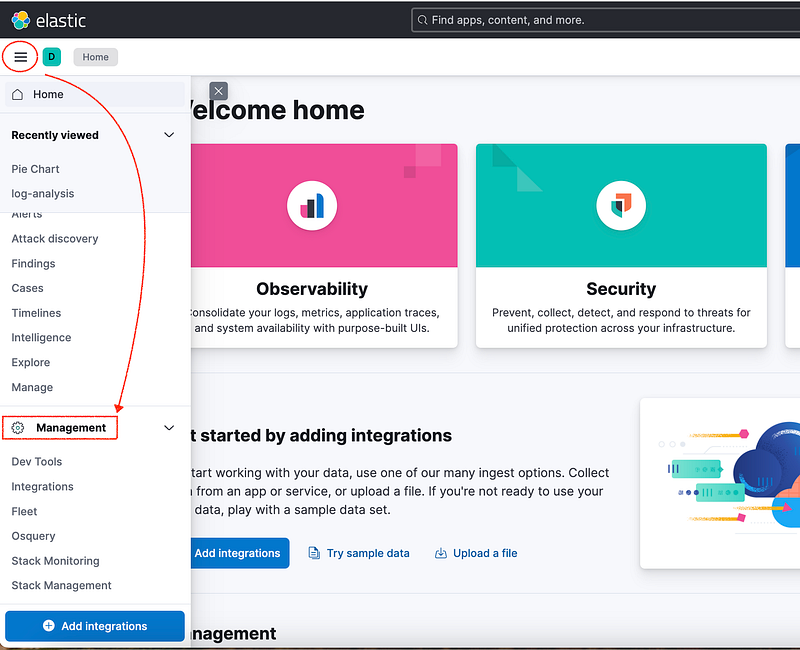
2. Go to “Index Management”:
- From the Add Data section, find and click on “Index Management” (if not directly listed, it might be under Management on the left-hand menu).
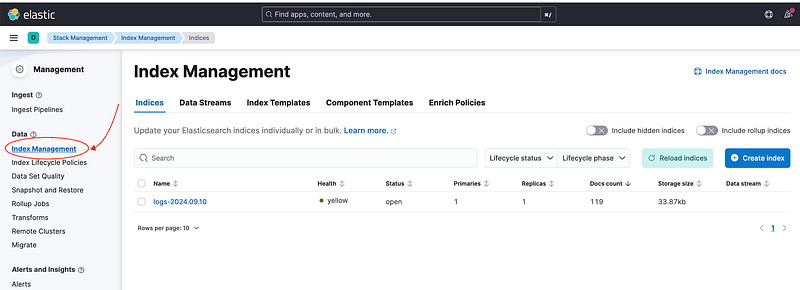
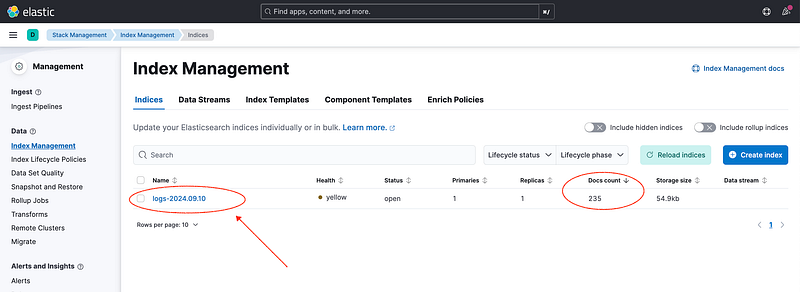
- You should already see the “logs-YYYY.MM.DD” Index created since you are sending the messages through Logstash from Kafka to Elasticsearch.
Step 6: Explore Logs in Kibana’s Discover Tool
Before creating visualizations, it’s useful to explore and inspect your log data.
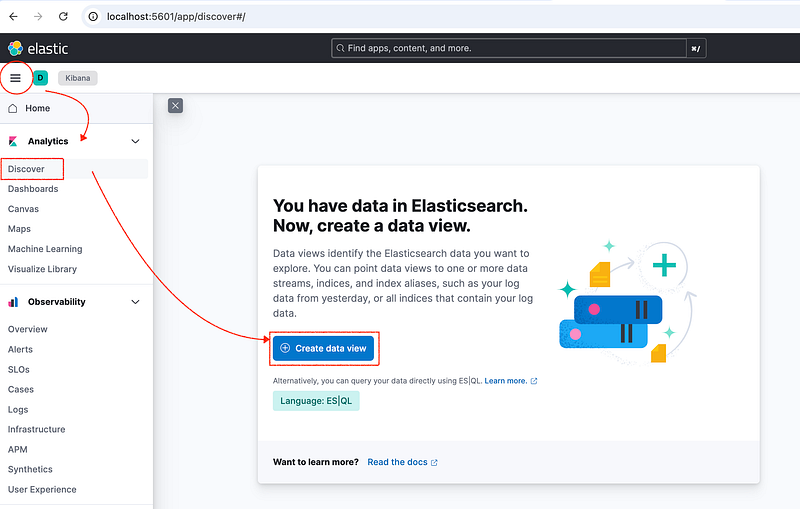
- Go to the Discover tab:
- Click on “Discover” from the left-hand side of the screen.
- Click on “Create data view” to view data in your index.
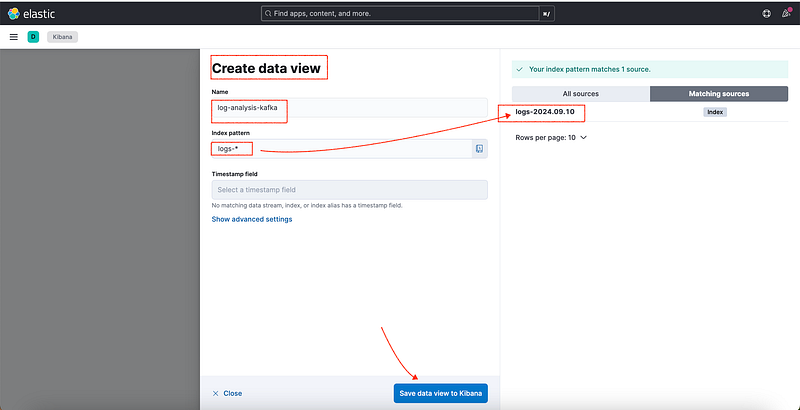
- Select the
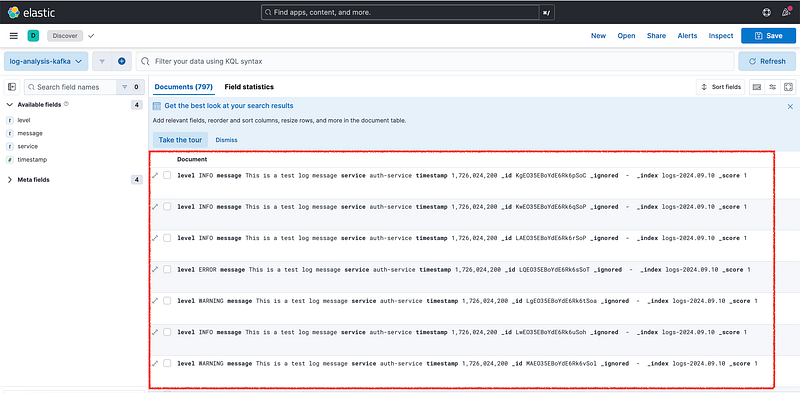
logs-*index pattern you created. - You should see log data that has been ingested from Elasticsearch.
- You can filter, search, and drill down into the logs to verify that your data is flowing correctly.
Step 7: Create a Dashboard
You can create visualizations and you can add them to a Kibana dashboard.
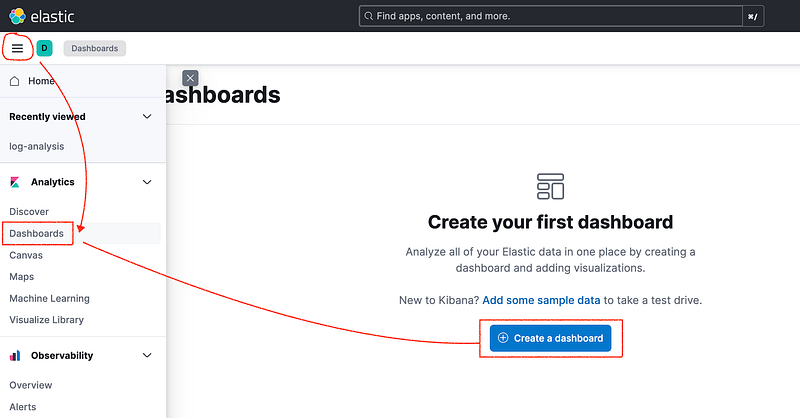
- Go to Dashboard:
- Click on Dashboard in the left-hand menu.
- Click Create a Dashboard.
2. Create Visualizations:
- You need to create a visualization to add it to your dashboard.
- Click Create visualization
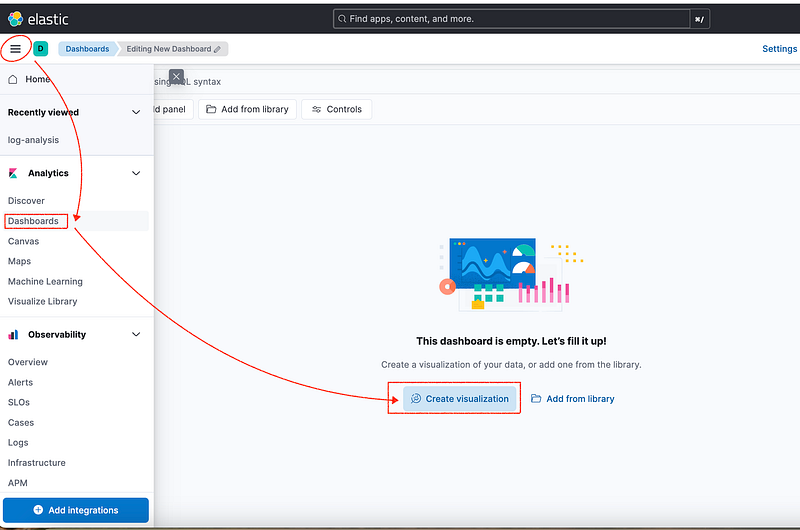
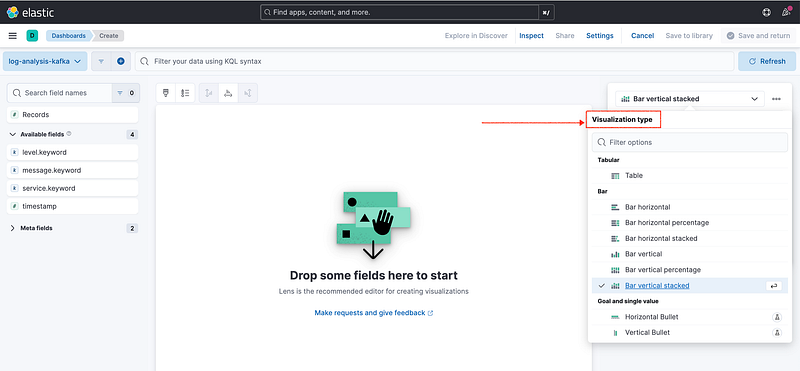
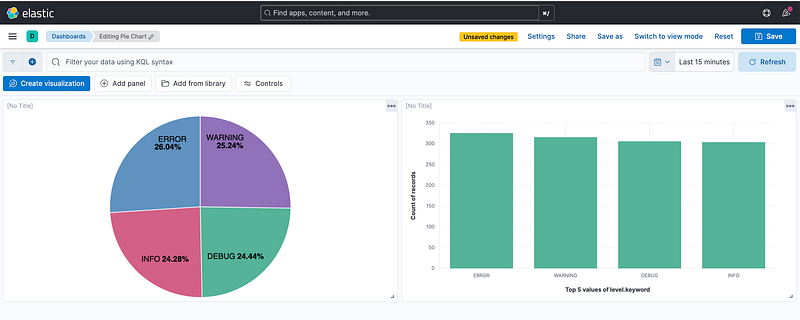
- Select the type of visualization you want to create (e.g., the “Pie Chart” or “Bar Chart”).
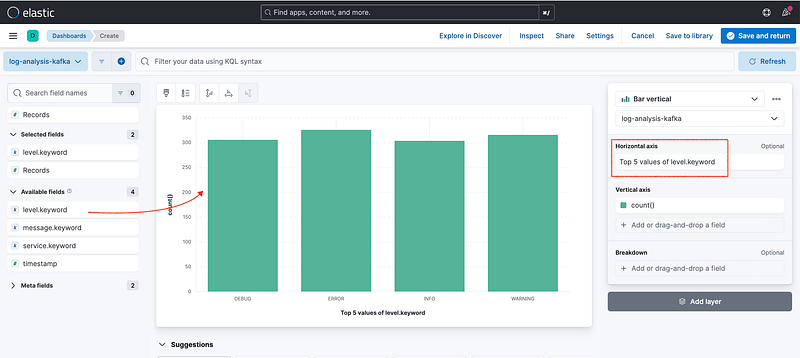
- Drag and Drop available fields from the left-side panel onto your chart to create visualizations. Just like how you would create visualizations on your Tableau or Power BI Dashboards.
- Choose the right visualization that fits your needs and hit “Save”.
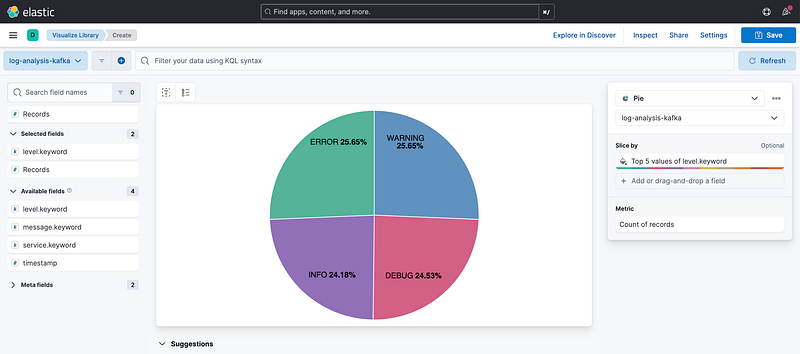
- You can add multiple visualizations to the dashboard and arrange them as needed.
3. Save the Dashboard:
- Once you’re satisfied with the layout, click Save.
- Give your dashboard a name (e.g., “Log Analysis Dashboard”).
Step 8: Customize Your Visualizations and Dashboard
You can continue to customize your visualizations based on your needs. Some additional ideas for dashboards:
- Log Level Over Time: A line chart showing the number of logs at each level (INFO, ERROR, etc.) over time.
- Service-Specific Logs: Visualizations that filter logs based on the
servicefield to monitor different microservices or application components. - Error Rate Alerts: You can set up alerts in Kibana to notify you when a certain error rate threshold is exceeded.
Conclusion
With Kafka streaming your logs, Logstash processing them, and Elasticsearch storing your data, you have a powerful pipeline for handling log data. Combined with Kibana’s intuitive UI, which allows for easy filtering, searching, and real-time visualization, you can monitor and analyze your logs effectively. By setting up an index pattern, creating insightful visualizations, and building a custom dashboard, you can gain deep insights into your system’s behavior and quickly diagnose issues as they arise.
Feel free to reach out if you encounter any challenges or need assistance with building specific visualizations!

Thanks for Reading!
If you like my work and want to support me…


