
How to Build a Desktop App Using Tauri
Plot the values of a function in Rust

Chances are high that you have already heard of the framework Tauri that helps create Desktop apps. If not, no problem, in this story we are going to look at other things at their basic functionality.
You might wonder why this story is related to Rust. The quick answer is, Tauri is built in Rust and moreover uses Rust as runtime. In particular, it allows us to define our own functions in Rust and call them from within the UI! In Tauri, the UI is running in a native browser that usually has not to be shipped with the app. So the languages for building the UI are JavaScript, HTML, and CSS.
The typical way of running Rust implemented code within a browser, is to compile the code to WebAssembly. Besides the portability advantage, this also comes with some essential drawbacks. A Rust developer who uses Rust’s facilities to write super efficient and performant code (like for scientific computations, simulations, and machine learning), won’t be very satisfied if the code is compiled into a much less efficient language like WebAssembly. Moreover, when it comes to multi-threading and parallel computations, the thing with WebAssembly becomes tricky up to impossible.
In this sense, Tauri is totally different. Here we can write Rust code without any restrictions and can be assured that the code will run in production with the same performance as it was targeted for. But remember, Tauri is for Desktop apps! So if you need an application that is running on the web as well, you better go with PWA’s. At the time of writing, Tauri has serious plans to also support Mobile apps. Of course, this would become a big game changer for many other technologies (see here).
My focus, as usual, is on scientific computations. I want to present a quick setup on how to do some nice simulations of a dynamic system within Tauri (leaving the world of Python and Julia aside for some time). Some basic knowledge of Rust (see here in case you need a wrap-up) and some very basic knowledge of web development are the prerequisites to understand this article.
Setup
Before being able to build something with Tauri, there are a few things necessary to be installed on your system (all these things are not necessary for the final executable product).
Detailed prerequisites are well documented here. It also contains a nice instructions on how to install Rust. Besides Rust, we need Node.js installed that comes together with the package manager npm. In case you use Windows, it is necessary to have webview2 installed — Tauri is using this as the embedded browser.
Tauri provides a utility function that allows you to quickly auto-generate a new project. You can use it like so:
npm create tauri-appYou will be asked a few questions (I give my selections next to it):
name of the project: logistic-chaos
package-manager: npm
ui-template: vanilla-ts
After this it asks you to run the following steps, which essentially downloads the packages and then run the application in dev mode:
cd logistic-chaos
npm install
npm run tauri dev
After some minutes of compilation, this should open a new window that contains the UI.
Application structure
Two folders are important when building apps with Tauri.
The first is src that contains all the assets for the UI and the second is src-tauri/src.
The latter contains among a Cargo.toml a main.rs that enables us to define Rust functions that can be called from within the UI.
A small example of this already is contained in the generated project:
#[tauri::command]
fn greet(name: &str) -> String {
    format!("Hello, {}! You've been greeted from Rust!", name)
}
But we will soon create our own. This function is then callable from within JavaScript code as it can be seen in src/main.ts:
import { invoke } from '@tauri-apps/api'async function greet() {
await invoke('greet', { name: 'applied.math.coding' });
}That is really amazingly easy and moreover, all the calls are asynchronous. In particular, this means we do not have to create complicated WebWorker constructs in order to keep the browser window responding to user events in case such a function call takes longer to return.
The root directory contains a package.json that supports npm in managing the front-end assets. Other than this, some configuration files like vite.config.js and tsconfig.json can be found there. These are files that can be used to fine tune the building and compilation process of front-end sources.
Let us jump next directly to an example that shows you with how less effort you can create a nice application. Of course, there is actually much more to tell about Tauri’s configurations and capabilities, but my aim with this story is to show how fast you can do something useful with it.
Building an example app
Our goal will be to plot the values of a function that are computed in Rust. We already learned, Rust functions that are handed over to the client side must be registered at main.rs. There we add the following code:
#[tauri::command]
fn plot_logistic_map(a: f32, b: f32, delta: f32, r: f32) -> (Vec<f32>, Vec<f32>) {
    let mut res = (vec![], vec![]);
    let mut x = a;
    while x <= b {
        res.0.push(x);
        res.1.push(logistic_map(r, x));
        x += delta;
    }
    res
}
fn logistic_map(r: f32, x: f32) -> f32 {
r * x * (1.0 - x)
}The function that is exposed to the front end is plot_logistic_map. It takes some parameter that essentially describes in which interval the function values shall be generated. Important is the macro #[tauri::command] that tells Tauri to make this function available as a command. With this, the front-end is able to call it. The used function arguments and return values are almost arbitrary. The only thing is, serde must be able to de/serialize them.
Moreover, direct the function main we have to register our method with Tauri’s invoke handler:
...
.invoke_handler(tauri::generate_handler![greet, plot_logistic_map])
...
As you can see, the previously considered function greet is already there.
In order to plot, we are going to use the superb plotting library plotly. We add it to our front-end resource by
npm i plotly.js-distThe next thing is to define a plotting area in the front end. For this we alter the index.html to look like so:
<!DOCTYPE html>
<html lang="en">
  <head>
    <meta charset="UTF-8" />
    <link rel="stylesheet" href="/src/style.css" />
    <meta name="viewport" content="width=device-width, initial-scale=1.0" />
    <title>Logistic Chaos</title>
    <script type="module" src="/src/main.ts" defer></script>
</head> <body>
<div id="plot" style="width:600px;height:250px;"></div>
</body>
</html>The part in bold is the area in that the plot will be drawn. Also, as you can see in the index.html, the entry code for JavaScript is hosted in src/main/ts. It is here where we call to compute the function’s value and to plot them:
import { invoke } from '@tauri-apps/api';
import * as Plotly from 'plotly.js-dist';
const plotLayout = {
margin: { t: 0 },
yaxis: {
range: [0, 1]
}
};async function getData(a: number, b: number, r: number)
: Promise<{ x: number[], y: number[] }> {
const [x, y] = await invoke(
'plot_logistic_map',
{ a, b, delta: 0.001, r }
) as [number[], number[]];
return { x, y };
}window.addEventListener('DOMContentLoaded', async () => {
Plotly.newPlot('plot', [await getData(0, 1, 1)], plotLayout);
});We invoke the command plot_logistic_map by passing the parameters to compute the value for the interval [0, 1] with a grid of width 0.001. The result is then passed as data to Plotly.newPlot.
Now, we can run:
npm run tauri devand a window appears with the plotted function inside:

Running Tauri like this makes the front-end re-rendering whenever you do any changes in the code. This is very handy for quickly plotting functions and testing different parameters.
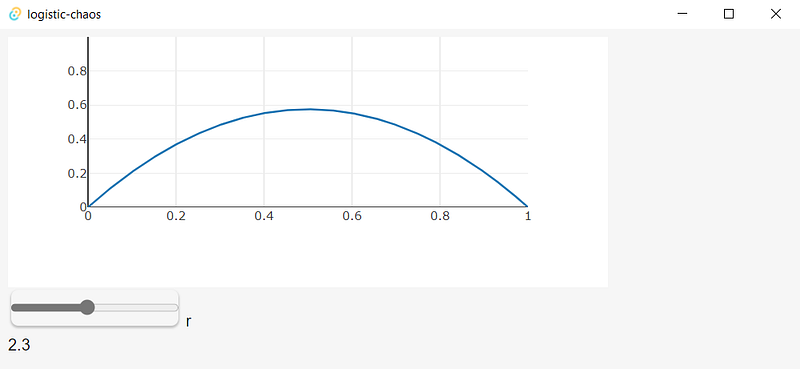
Since our front-end is running as a web app in the browser, we can use all sorts of typical features it provides. So for instance, menus, styling, using web frameworks like Vue.js, and user interactions. For the latter let us add a small example — you may have recognized the parameter r in the plotted function. We are going to enable the user to change it on demand from the UI meanwhile the plot is refreshing to the new value:
First, add the following snippet to the index.html — the code supports the number slider for r:
<div>
    <input type="range" id="rParam" name="rParam"
           min="1" max="4" value="1" step="0.1">
    <label for="rParam">r</label>
    <div id="rValue">1</div>
</div>
At main.ts we are going to add a handler that reacts to changes in the slider by triggering the Rust function with a new value for r and then to re-render the plot:
document.getElementById('rParam')?.addEventListener(
  'change',
   async e => {
      const r = +(e.target as any).value;
      document.getElementById('rValue')!.innerText = `${r}`;
      Plotly.newPlot('plot', [await getData(0, 1, r)], plotLayout);
   }
);
On saving the code, Tauri will have re-rendered the window, so we have to do nothing than test our changes:

Small bonus
Before coming to the end and explaining how one can build and ship such an application, let me give you some more plots that explain the name I have chosen for this app. Of course, just skip this section in case you quickly want to get started with your own Tauri app!
The dynamical system corresponding to the logistic map is the following:
x_{n+1} = r*x_n*(1-x_n)This iteration, when starting with some x_0, produces a list of values. The interesting fact about this dynamics is, that for different values of r it shows very different behavior. Especially regions where the above dynamics has periodic points of length 3, that is, starting with such a x_0 brings us back to x_0 after 3 iterations (x_3 = x_0), are showing interesting patterns. For such values of r there exists starting points x_0 that don’t show any periodic patterns but look kind of chaotic:
In case you want to play around with this, feel free to clone thee following repository. Of course, in order this to run properly, you will have to make your system fulfilling the above requirements and to issue the following commands from within the project root:
npm inpm run tauri devBuilding and publishing the app
We only cover the very basics here. You will find lots more about this subject in Tauri’s documentation. Among others, Github actions supports cross-platform compilations and signing the app!
To ensure all runs without errors, we will have to change the following entry at tauri.conf.json:
tauri > bundle > identifierYou can put here any value — I changed it to just ‘logistic-chaos’.
To build the project we just have to run
npm run tauri buildThis compiles all the resources and creates an executable at the following location: (if you are on Windows)
src-tauri/target/release/logistic-chaos.exe (executable)src-tauri/target/release/bundle/msi (installer)Also notable is that Tauri provides options on how to deal with the required webview2. Among others, it can be chosen to be downloaded and installed during the installation process or even bundled together with the app. Of course, all this has a huge effect on the build size.
Conclusion
I hope to have shown that Tauri provides a promising alternative or at least one that is worthwhile.
Of course, at this time, Rust’s arsenal for things like matrix manipulation or other numerical algorithms is very limited, but I think Tauri is pacing a new way and invites many developers and scientists to recognize Rust’s capabilities. For instance, if you put mathjax to the UI, you could use your app as an interactive presentation.
Thanks for reading!


