
Building a bitcoin dataset
Good analysis starts with clean complete and good data. I have been looking for good datasets on bitcoin for a while, but couldn’t find anything that matched with what I was looking for. I decided to create my own dataset that I can use for different purposes. I wanted a dataset with reliable data, so my journey started with finding the right sources and instruments.
Build in Python
When datasets start to exceed the dimensions of google sheets or Excel, you’d better start looking for different solutions. I decided to use Python. More specifically, I’m working with PyCharm to write and evaluate the code and using the pandas and numpy package that provide appropriate tooling to first build the dataset and later analyse it. An easy way to build datasets is by using the DataFrame data structure functionality and read the CSV-files into a dataframe. Now that we have found a good way to get all the data in one place where we can easily analyse, it’s time to actually collect the data.
Getting all bitcoin blockchain data
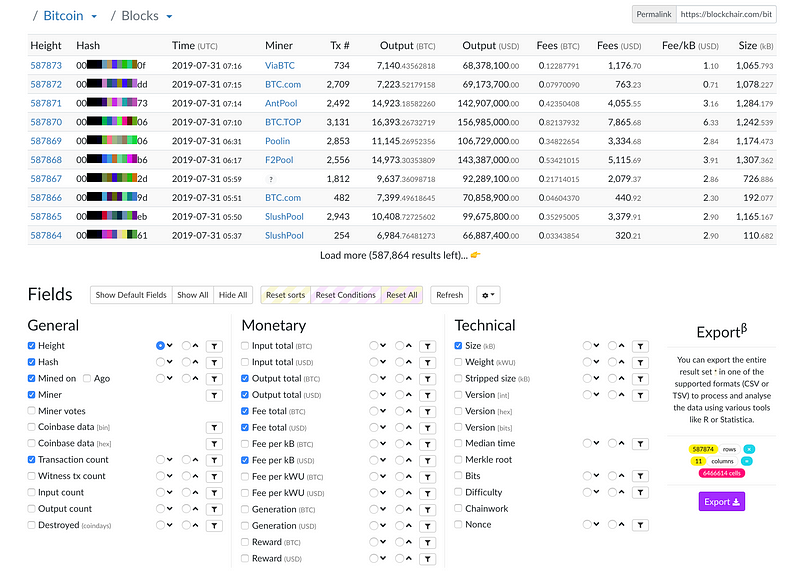
A great source to get all the bitcoin blockchain data you’re looking for is www.blockchair.com. In the bitcoin/blocks section of the site you can select what data you’d like to export to a csv file and download it from there.
Collecting bitcoin price data
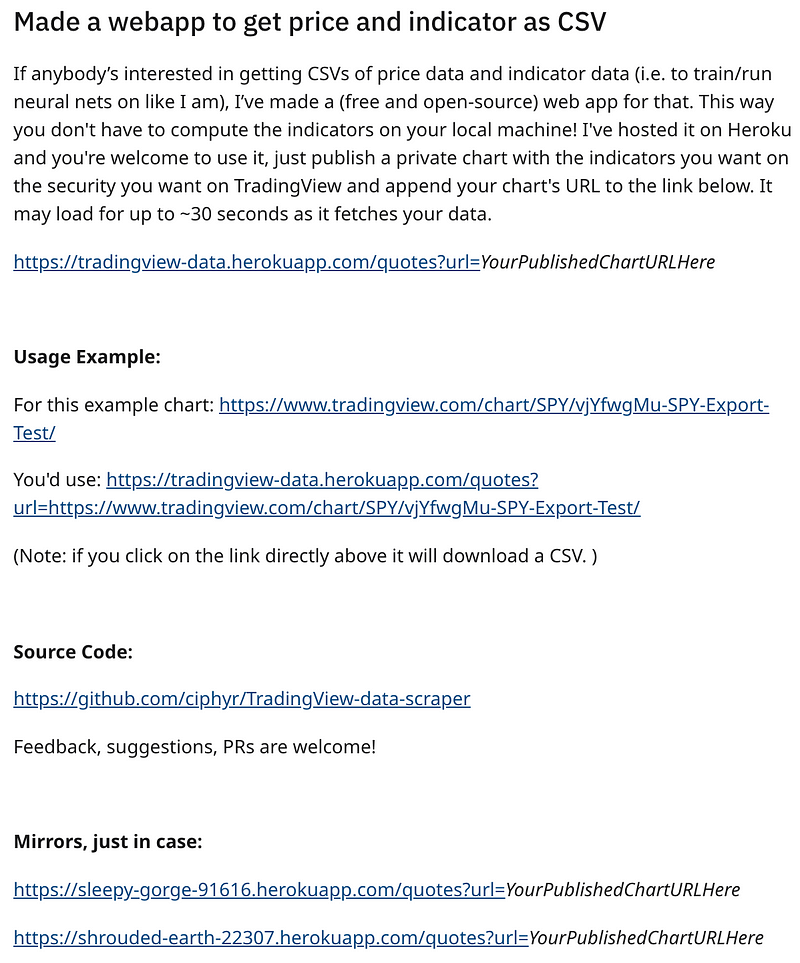
Finding reliable bitcoin price data that goes back to the early days of bitcoin is a challenge. A good source for the data is the BraveNewCoin liquid index from TradingView. Unfortunately, TradingView doesn’t offer CSV export functionality, but I figured there must be more people around dealing with that same wish. (The wish to convert TradingView data to a downloadable CSV file). I stumbled on a reddit post from someone who made a web based application to generate a csv file from a privately published TradingView chart. Great! Now I was able to get all historic bitcoin price data as of October 2010 from a reliable source.
Blending all the data together
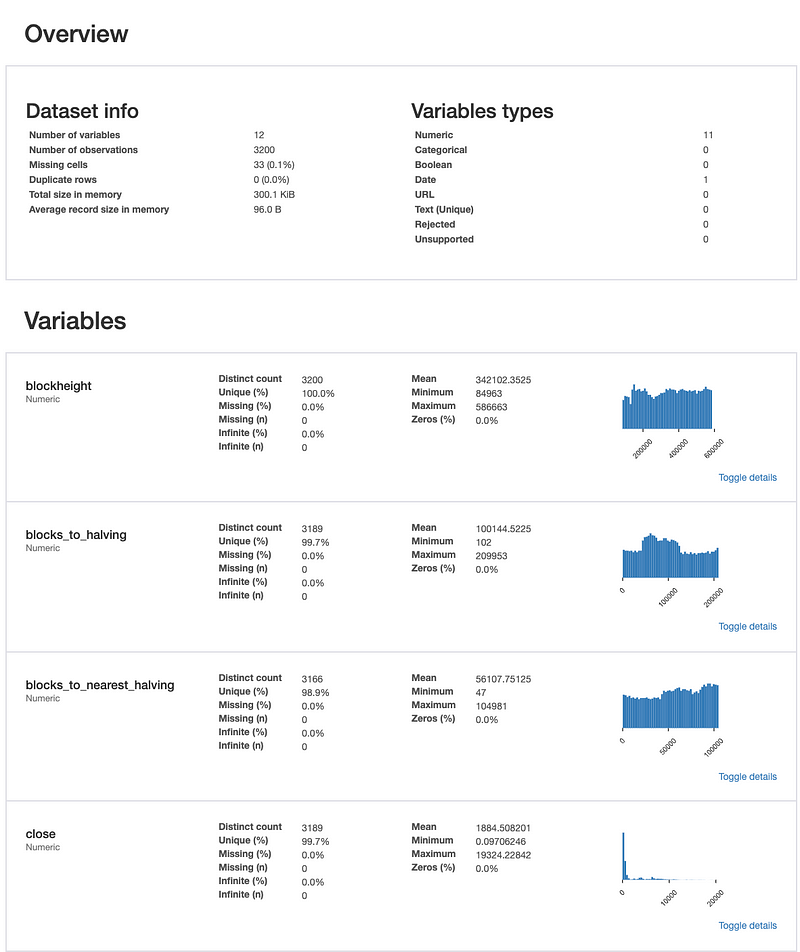
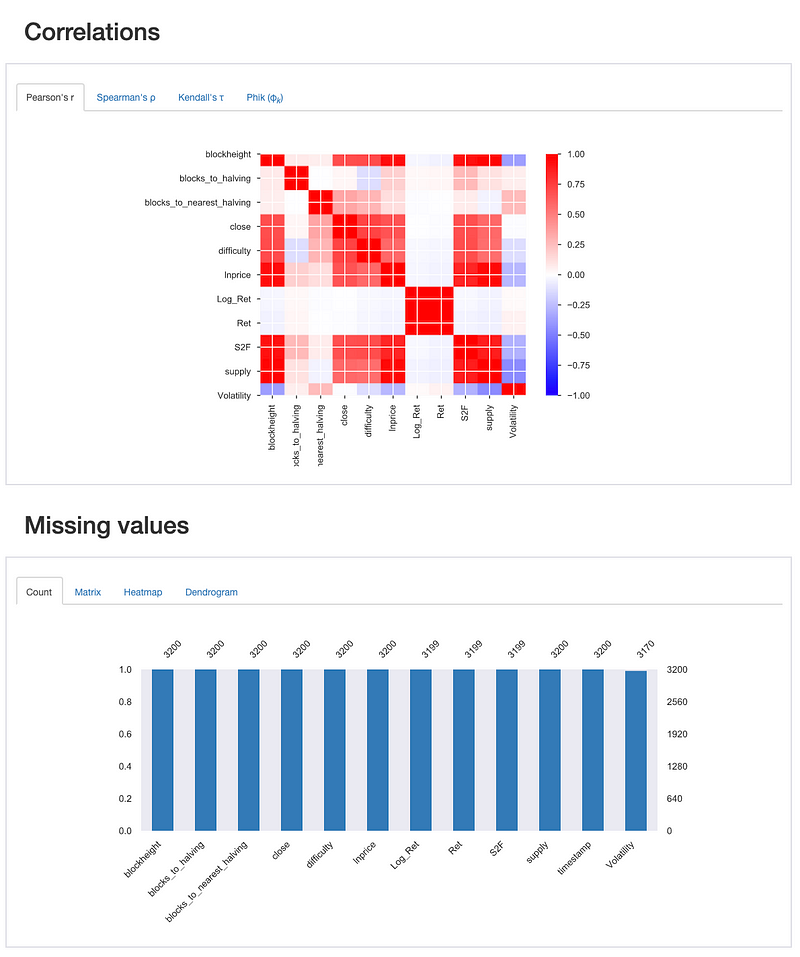
The collected price data is on a daily timeframe, while the bitcoin blockchain data is based on blockheight. In order to merge the data, I had to resample the bitcoin blockchain data to daily data, where I used the max for the blockheight and the average difficulty for all blocks on a given day. After blending all the data together, you want to know if it all looks good enough to proceed with further analysis. The Pandas Profiling is a very convenient package to do exactly that. It’s comparable to the df.describe functionality of pandas itself, but a profile reports offers just a little more. It let’s you for instance generate an html output file, which enables you to review all your data with the greatest ease by showing you a summary of the statistics on your dataset.
Encountered challenges
Every programming or scripting language has its own challenges in terms of syntax. One issue I encountered was that the headers of my columns disappeared after resampling the data. From the dataframe where I stored timestamps and blockheight (df_tsbh), I had to go to a version based on daily data while preserving all the column headers of the dataframe. Here’s how I solved the issue.
#Blockheight by day
func = {
    'blockheight': df_tsbh['blockheight'].resample('1d').max()
}
df_daily = pd.DataFrame(func)
Final Remark
Remember that data analysis based models start with reliable well structured data. Now that my data is well structured, coming from reliable sources and complete, I’m able to run all kind of different analyses and build models upon the results of these analyses.
References
[1]: Python Download: https://www.python.org/downloads/
[2]: PyCharm Download: https://www.jetbrains.com/pycharm/download/
[3]: Web based application to convert TradingView data to CSV: https://www.reddit.com/r/algotrading/comments/b543yn/made_a_webapp_to_get_price_and_indicator_as_csv/
[4]: Bitcoin blockchain data: https://blockchair.com/bitcoin/blocks
[5]: Dataset: https://github.com/MarcelBurger/Bitcoin-Data-Analysis/blob/master/bitcoindataset.csv
[6]: https://www.kaggle.com/civilian/bitcoin-dataset-20102019


