
Build Your Own Pokedex Web App With Streamlit
Search, filter, and display Pokemon stats and identify similar Pokemon
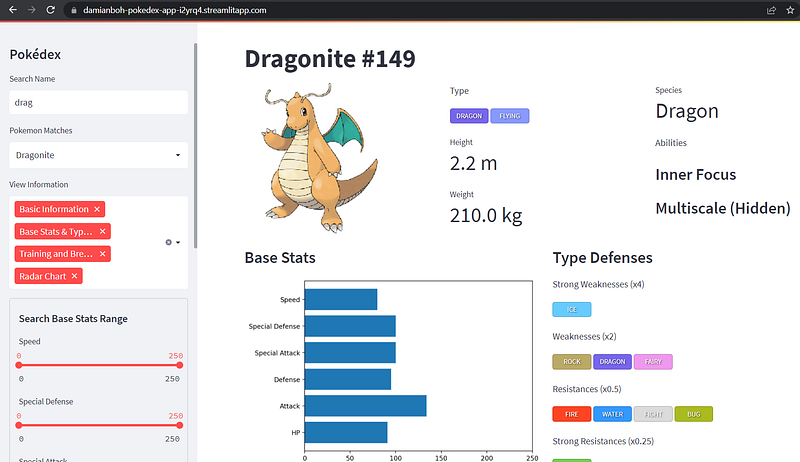
In this article, we will build a Pokedex web app on Streamlit (screenshot above). The end product is deployed here: https://damian-pokedex.streamlit.app/.
This web app allows the user to search through a Pokemon dataset by:
- its name and dropdown menu of name matches
- filtering through the base stats (attack, defense, etc.) range using a series of sliders
For each Pokemon, it displays its picture, type, species, abilities, base stats in a bar chart, and weaknesses and resistances. Training and breeding information are also available.
My favourite part of the app is that it displays the radar chart of the base stats of a Pokemon, and it can search for 20 Pokemon with the most similar base stats and their corresponding radar charts as well. I had a lot of fun with that function, searching for Pokemon similar to legendary birds like Moltres, starter Pokemon like Charmander, or even very weak Pokemon like Pidgey.
The full code for this project is given in the following GitHub repo.
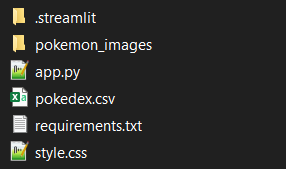
For the app to work, these are the required files and folders, also in the GitHub repo.
If you would like more information on Streamlit and how to deploy web apps online, feel free to take a look at my previous article below.
Datasets
First, let’s look at the datasets involved.
Pokemon dataset
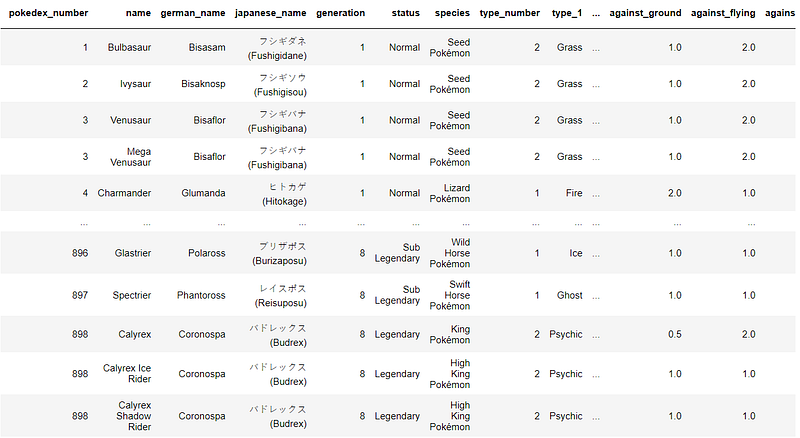
The first dataset can be obtained as a .csv file from this Kaggle link. As you can imagine, most of the code will be on parsing this dataset and displaying it in a nicely formatted way on Streamlit. For the codes to work, this file should be renamed to ‘pokedex.csv’.
Pokemon images dataset
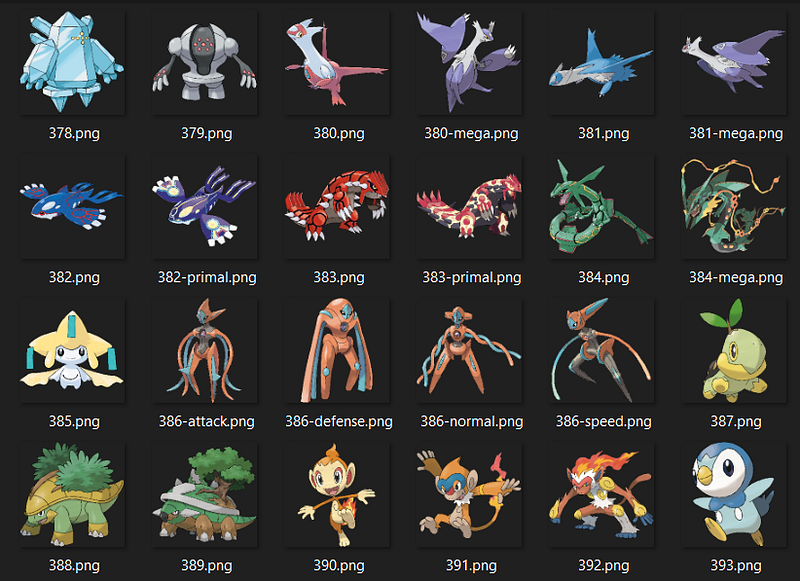
The Pokemon images are available in a folder, also from Kaggle here. The images are named according to the Pokedex number of each Pokemon. Note in the screenshot below that certain Pokemon have different variations, such as Primal Groudon, Primal Kyogre, Mega Latios, and also the Normal, Attack, Defense, and Speed Forme of Deoxys.
This means a function has to be written to look for the image path for each Pokemon corresponding to its pokedex number and variation. All the images are placed in the folder named ‘pokemon_images’ for the codes below to work.
Without further ado, let’s dive into the code. The main bulk of the code is given in the app.py file.
Imports and Page Config
First, we need the following imports: PIL to display Pokemon images, numpy and pandas to read and parse the pokedex.csv file, and of course matplotlib and plotly to show the plots of the Pokemon stats. We also set the page title and configured the layout to be ‘wide’ to display as much information in our Pokedex as possible neatly.
Read in Pokemon Dataset and CSS File
Next, we define two functions and call them at the app's start.
The local_css function reads in a style.css stylesheet file. I will not go through the details of the file, but you can view it here. Basically, it consists of style information to display the Pokemon types in a nice format, as shown below. These types are displayed in a neat font, and each type is associated with a different color to make it look more ‘pokemon-ey’!

Line 4 of the above code reads in the CSS file and writes it out as HTML code placed in the middle of <style> tags. HTML code can be written in Streamlit using the markdown() method. We can now access the classes defined in the stylesheet later.
The get_data function reads the pokedex.csv file into a DataFrame called df for parsing and filtering later. For simplicity, we only keep the first 846 Pokemon (up to generation 6) by slicing using iloc.
Sidebar: Search Pokemon by Name
We are now ready to program some UI elements! Let’s start with the elements to search a Pokemon by its name and return the name matches.
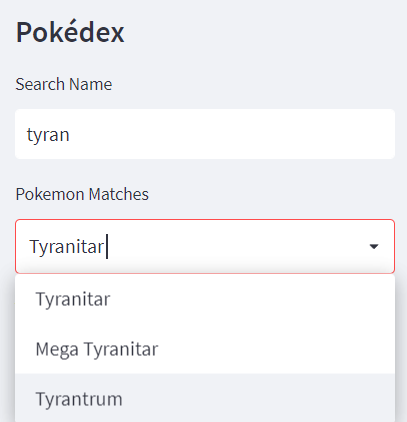
In the following code, we first print the sidebar's title as Pokédex. We then include a text_input field in line 3 for the user to input the name. We compare this input to all the names in the df DataFrame and return the name matches in the matches list in line 5. To avoid any case sensitivity issues, we convert both the user input and the Pokemon names in the DataFrame to lowercase using the lower() method before comparing them.
If there are any name matches, we output the matches list into a dropbox (called selectbox in Streamlit) in line 8 of the above code, allowing the user to select the exact name of the Pokemonsof interest. In line 13, we then return the relevant row of the DataFrame that corresponds to this particular Pokemon. This row is called match and is very important as all the information in it will be parsed and output into the main page.
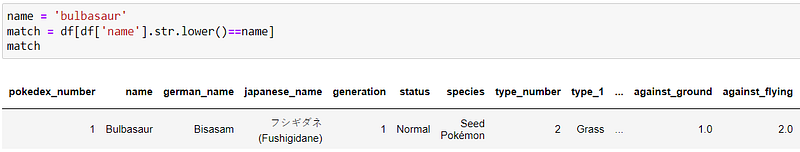
An example of the row corresponding to Bulbasaur is shown below.
Sidebar: Select Which Information to View
The next part of the sidebar is a multiselector which allows the user to choose which information to display on the main page of the Pokedex. For example, users who find the Training and Breeding information boring can cross it off. By default, all the information is selected.
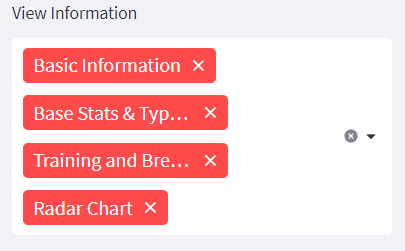
The code above shows how the multiselect field is designed. The four sections of information in the main page are ‘Basic Information’, ‘Base Stats & Type Defenses’, ‘Training and Breeding’, ‘Radar Chart’. The output from this field is stored in the selected_info list, which will be used towards the end of the article when we are displaying all the information about the Pokemon.
Let’s now dive into the functions for displaying each of the Information first.
Display Basic Information
The basic information of the Pokemon consists of its image, type, height, weight, species, and abilities. This information is displayed in three neat columns in the following manner, using Mewtwo as an example.
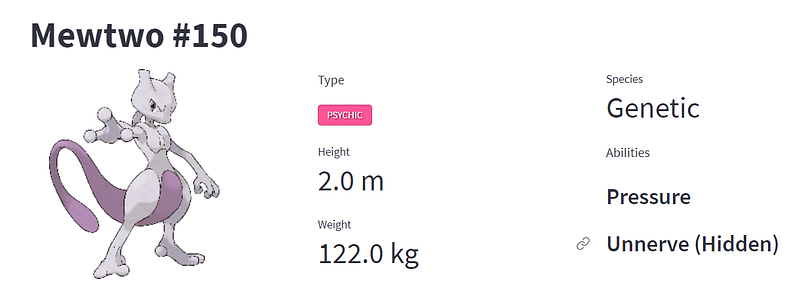
All this information is stored in the function named display_basic_info. The function takes in the match variable, which is the row in the DataFrame corresponding to the Pokemon of interest explained earlier.
The first part of the above function extracts the relevant information (height, weight, species, etc.) from the match row and the corresponding column names. Line 15 then prints the Pokemon name and id as the title, e.g., “Mewtwo #150” as shown above. Then we split the UI into three columns: col1, col2 and col3 in line 16 to display the information neatly.
The next part of the function shown above displays the image of the Pokemon in the first and leftmost column col1. First, a function get_image_path() is called in line 3 to find the image path of the Pokemon from its name and id. You can find this function in the app.py file. I will not go into the details of the function, but basically, code has to be written manually to pull images of Pokemon with different variations, as discussed earlier (e.g., Mega, X, Y, different Formes, different Cloaks, etc.).
We then open the image using the Image method under the PIL library and display it (lines 4 and 5). We put the whole code in a try except block so the app does not break if the image is not found. Rather, it will just display ‘Image not available.’
The code above displays the type, height, and weight attributes in the second column col2. These variables were already extracted at the start of the function. Note that thetype_text in line 5 is written in HTML between <span> tags. The class attribute corresponds to the class defined in the style.css file mentioned earlier. This displays the Pokemon type in a nicely formatted way.
For example, the HTML code to display the fire type is <span class=”icon type-fire”>fire</span>. Lines 6 and 7 add to the HTML code stored in type_text if there is a second type for the Pokemon.
Line 9 displays this code in HTML. Lines 10 and 11 then display the height and weight using the metric method in a really neat way shown in the screenshot earlier.
Finally, the code above displays the species and abilities in the rightmost column col3. Not all Pokemons have all three abilities, hence the need for the if loops to show abilities only if they are present.
Display Base Stats Chart and Type Defenses
The base stats and type defenses are displayed in two columns in the following manner, once again using Mewtwo’s information as an example.
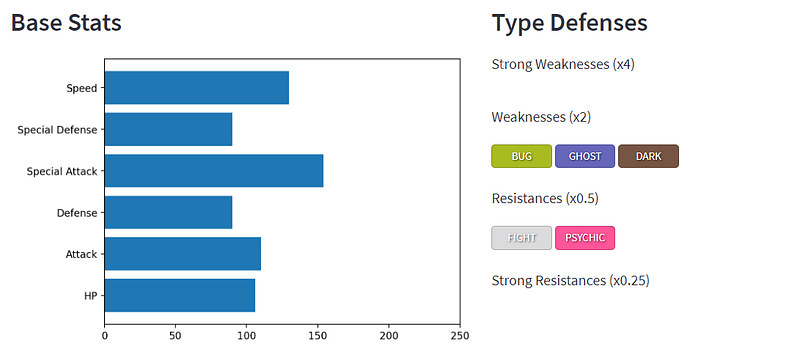
The code for displaying this information is under the display_base_stats_type_defenses function.
The first part of the function above shows how the type weaknesses and resistances are parsed and stored. The dataset, i.e. match row, does not store the weaknesses and resistances in lists. Rather it shows the damage multiplier that each type can do to a particular Pokemon.
For example, in the row shown below, the Pokemon is weak against_flying as flying types do 2x the damage. Also, while it is resistant against_fairy as fairy types only does 0.5x the damage to it. Note that Pokemon with multiple types can be doubly weak (x4) or doubly resistant (x0.25) against certain types.

In Lines 10 to 21 of the code above, we loop through each of these columns to find the damage multiplier values and store them in the corresponding weaknesses (x2 and x4) and resistances (x0.25 and x0.5) lists defined in lines 3 to 6. Note that we are not interested in values with 1.0x multiplier as the Pokemon is neither weak nor resistant against these types.
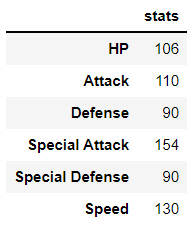
The code above then gets the base stats (hp, attack, etc.) of the Pokemon from the match row and renames the columns nicely in lines 4 to 6. The result is stored in df_stats , and its structure is shown below. These are then plotted on a horizontal bar chart using matplotlib in line 10 and displayed in the left column col1 in line 12. Note that the range of each base stat is from 0 to 250, and we fix this range on the x-axis.
The final part of the code shown above loops through each of the types in the weaknesses and resistances type lists and display them in the right column col2 accordingly. Once again, we use HTML to ensure that the types are displayed in a nice style, as explained before.
Display Training and Breeding Information
The next part of the app displays the training and breeding information in two columns below:
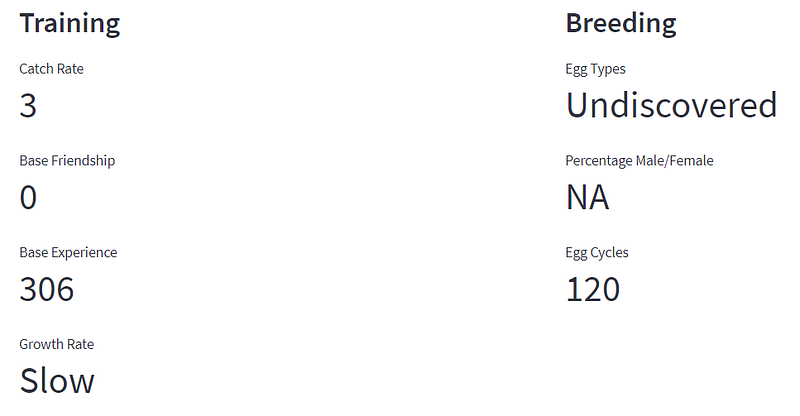
The code for getting and displaying this information is under the display_training_breeding function. As this is similar to the other display functions above, I shall leave it as an exercise for the reader to figure out the code!
Note that breeding information is not always available. For example, in the case of Mewtwo above, the Egg Types are Undiscovered. Hence, no Percentage Male/Female eggs information is available either, so we have to parse it accordingly in the code.
Display Radar Chart of Base Stats
I love radar charts because they display the Pokemon stats in such an elegant and symmetric way. The strengths and weaknesses can be easily identified from such a chart. Thankfully, the plotly express library allows us to plot this out easily. The radar chart for Mewtwo’s base stats is as shown.
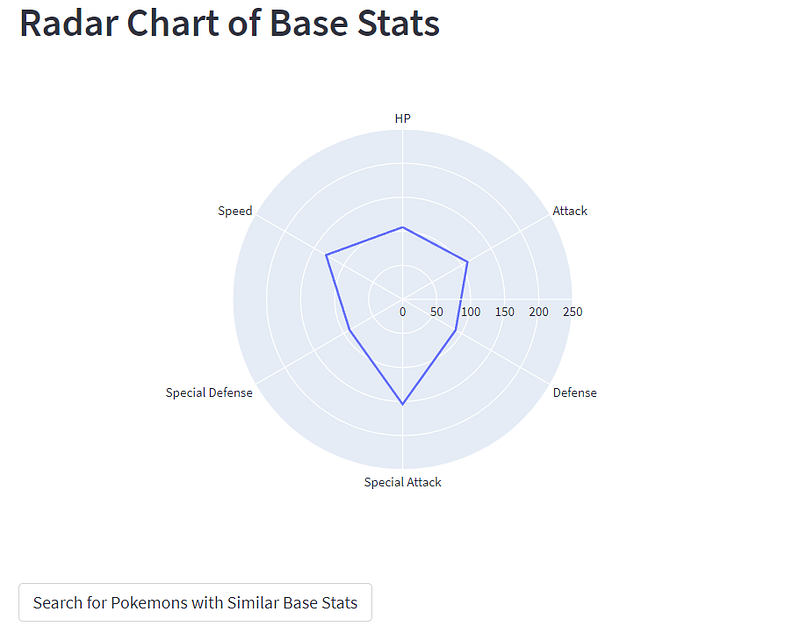
In the function above, we get the base stats and store it in df_stats, similar to how we did it when plotting the horizontal bar chart earlier. Line 9 then shows how we can use the plotly express library to splot this out in a radar chart, while line 10 displays it on Streamlit.
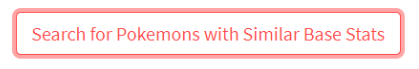
Now, wouldn’t it be nice to search through the whole Pokemon dataset for Pokemon with similar base stats? If you notice in the screenshot above, there is a button calledSearch for Pokemons with Similar Base Stats. When this button is pressed, we call another function to perform this, as shown in lines 12 and 13 of the code above.
Search for Pokemons With Similar Base Stats
As powerful as Mewtwo is, similar Pokemons are equally powerful. The two most similar Pokemons are shown below. Notice how similar their radar charts are compared to that of Mewtwo’s shown above. For the Pokemon fans out there, it may not be a surprise that Shaymin Sky Forme and Mega Houndoom are similar to Mewtwo.
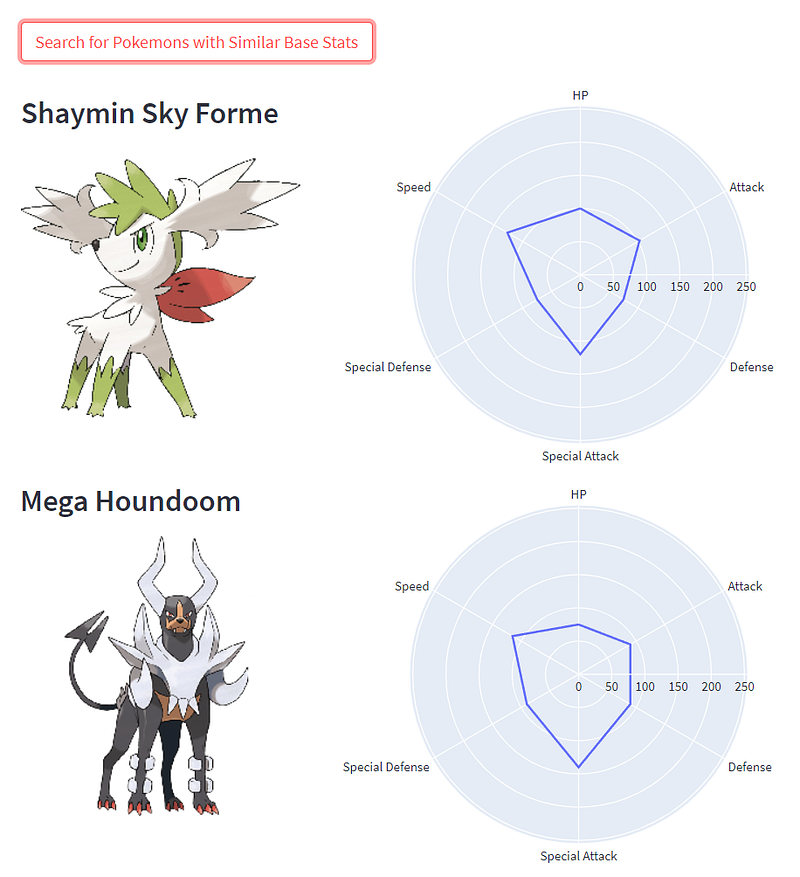
As mentioned at the start of the article, I really had a lot of fun with this function in the app. Feel free to try searching through Pokemons similar to Legendaries like Kyogre or even starter Pokemons like Charmander.
Now, let’s learn to do this in code:
First, we once again obtain df_stats to show all the stats of the Pokemon of interest. Then in lines 7 and 8 we get the stats of all other Pokemon in the entire df DataFrame and store it in df_stats_all. We then obtain the difference in stats between df_stats for this particular Pokemon and all the rows in df_stats_all in line 11.
We then use this difference to calculate the normed distance between each Pokemon and this particular Pokemon. This is done so using the np.linalg.norm function in line 14 and storing the distances in norm_df. Finally, we take the stats of the Pokemons with the 20 smallest distances (excluding the original Pokemon itself) and store them in the similar_pokemons_df DataFrame.
From our similar_pokemons_df DataFrame, we then use the code below to output the name, image, and radar chart of each of the Pokemon and display them. Finally, we display the summarized table of all the 20 similar Pokemons and their stats in the last two lines of the code.
Sidebar: Search Pokemon Within Base Stats Range
Now, let’s go back to one sidebar code segment I have not discussed. Here we have a series of sliders corresponding to each Pokemon base stats so the user can search for Pokemons within a certain base stats range.
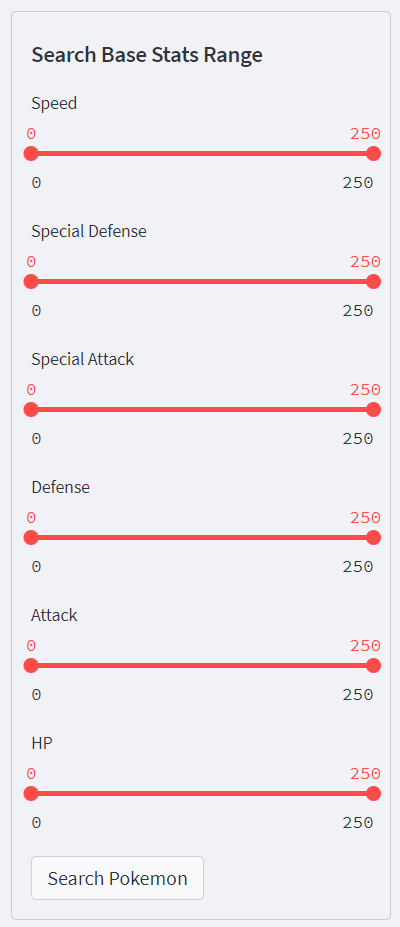
The code to display these sliders is shown below and is mostly self-explanatory. Note these sliders are linked together by grouping the code segment under the same st.sidebar.form with a corresponding submit button called Search Pokemon. The last line of the code stores the state of the button in a boolean variable pressed. This variable becomes True when the button is pressed.
When the button is pressed, we want to display all the Pokemon that corresponds to our search range. But first, let’s talk about what happens if the Search Pokemon button is not pressed.
Displaying Data After User Searches by Name
If the button is not pressed, it means that the user is using the Search Name function to search for a Pokemon of interest, and this is handled by the code below:
Recall in the earlier part of the article that the data of this Pokemon is stored in the row called match. After the user makes a selection, match would have exactly one row, and lines 9 to 16 of the code above call each display function to display the relevant information about the Pokemon.
Each function is only called if the user has selected the information to be displayed. Recall that the user can select this from the multiselector described earlier, and the user selected info is stored in the selected_info list.
Displaying Data After User Searches by Base Stats
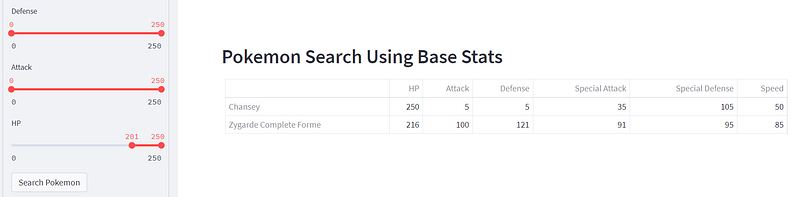
If the Search Pokemon button is pressed, the code below gets the stats of all the Pokemon and applies a filter to the range of stats that the user indicated in the sliders. All the corresponding Pokemon and their stats will then be displayed in a table. Note that we are not displaying the charts or other information about each Pokemon as this list can be rather big, and we do not want the app to crash!
An example of a user searching for Pokemons with rather high stats is shown below. These definitely aren’t ordinary Pokemon!
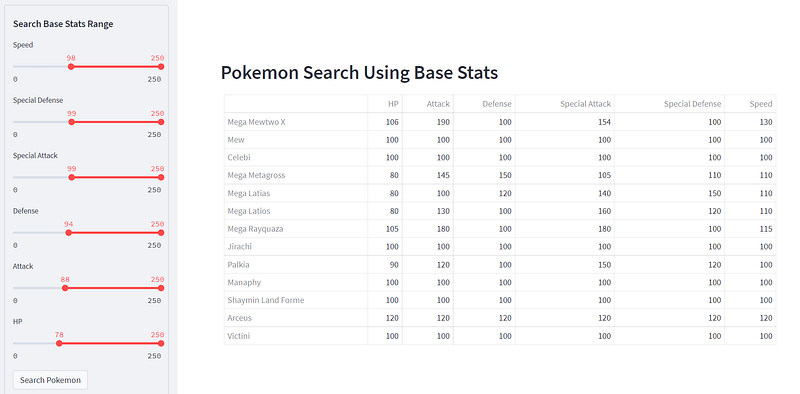
Here’s another fun fact: Are there Pokemons with an HP stat higher than 200? Yes! Introducing our beloved Chansey and Zygarde Complete Forme.
Sidebar Credits
Finally, let’s end off the app.py code with a disclaimer that we do not own any of the Pokemon data or images! :)
requirements.txt and config.toml files
In addition to the app.py file, we need to include a requirements.txt file to show the list of requirement Python libraries to install so these can be installed automatically on the server to which the app is deployed.
streamlit
pandas
plotly
matplotlib
Optionally, I have also created a folder called .streamlit which includes a config.toml file to set the base theme as ‘light’ instead of ‘dark.’
[theme]
base=”light”
Run the App Locally
That’s all you need for the app. To start the app locally, simply run the following command in the terminal, in the same folder as your app.py file. Make sure your pokedex.csv file and the pokemon_images folder are inside as well.
streamlit run app.pyIf you are successful, the following should appear:
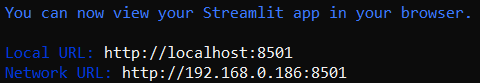
Your browser should also pop up with the above Local URL keyed in, and your Pokedex app should work in the browser! Congrats!
Deploying the App Remotely
If you want to deploy the app remotely like what I have done here, I have summarized three options in the article below.
Once again, here is the link to the GitHub repo.
Have fun with your Pokedex app; feel free to add or suggest new features!


