
Build & Deploy Diabetes Prediction app using Flask, ML and Heroku
End to End Machine learning project from training a model to deploy it on Heroku
Welcome my friend,
According to CNBC the trendiest job for the upcoming decade is Data Scientist and machine learning engineer. It is the best time for us to learn some machine learning algorithms and create some projects threw them.
You often saw that all those tutorials and blogs explaining about different types of machine learning algorithms but most of them does not show you how to build a project and then deploy it using those algorithms.
Don’t Worry, In this blog, we are going to create an end to end machine learning project then also going to deploy it in Heroku.
We are going to complete it in four steps
- Creating a model using machine learning
- Creating a web app using flask and connecting it with model
- Commit project to Github
- Deploy our model using Heroku
Before Getting Started Let’s First Setup our environment
- Download Latest Version of Python
2. Install Required Packages
all the packages can be installed using pip from cmd(terminal).
pip install pandas,numpy,matplotlib,scikit-learn,seaborn3. Install Jupyter notebook
pip install jupyter-notebookjupyter notebook ### for running
After Completing all the three steps, now let’s start working on our project.
Open a new notebook in jupyter, follow the below steps along
1. Creating a model Using Machine Learning
Import the necessary libraries
#importing Librariesimport numpy as np
np.random.seed(42) ## so that output would be same
import matplotlib.pyplot as plt
import pandas as pd
import seaborn as sns
%matplotlib inline ## our plot lies on the same notebook#models
from sklearn.ensemble import RandomForestClassifier
from sklearn.tree import DecisionTreeClassifier
from sklearn.linear_model import LogisticRegression
from sklearn.neighbors import KNeighborsClassifier
from sklearn.svm import SVC#Evaluation
from sklearn.model_selection import train_test_split,cross_val_score
from sklearn.model_selection import RandomizedSearchCV,GridSearchCV
from sklearn.metrics import confusion_matrix, classification_report
from sklearn.metrics import precision_score, recall_score, f1_score
from sklearn.metrics import plot_roc_curve#for warning
from warnings import filterwarnings
filterwarnings("ignore") ## To remove any kind of warningLoad the dataset
The dataset is available at Kaggle but we are going to use mine Github link to load the data.
data = pd.read_csv("https://raw.githubusercontent.com/Abhayparashar31/Diabetes-prediction/master/diabetes.csv")About the Dataset
The datasets consist of several medical predictor (independent) variables and one target (dependent) variable, Outcome. Independent variables include the number of pregnancies the patient has had, their BMI, insulin level, age, and so on.
Columns
Pregnancies: Number of times pregnant Glucose: Plasma glucose concentration a 2 hours in an oral glucose tolerance test blood pressure: Diastolic blood pressure (mm Hg) SkinThickness: Triceps skinfold thickness (mm) Insulin: 2-Hour serum insulin (mu U/ml) BMI: Body mass index (weight in kg/(height in m)²) DiabetesPedigreeFunction: It provided some data on diabetes mellitus history in relatives and the genetic relationship of those relatives to the patient. Age: Age (years) Outcome: Class variable (0 or 1) 268 of 768 is 1, the others are 0
Task
To build a machine learning model to accurately predict whether or not the patients in the dataset have diabetes or not?
EDA on Dataset
print(data.shape)  ### Return the shape of data
print(data.ndim)   ### Return the n dimensions of data
print(data.size)   ### Return the size of data
print(data.isna().sum())  ### Returns the sum fo all na values
print(data.info())  ### Give concise summary of a DataFrame
Let’s Visualise the Some columns and compare them
data["Outcome"].value_counts().plot(kind="bar",color=["salmon","deeppink"])
plt.xticks(np.arange(2), ('No Diabetes', 'Diabetes'),rotation=0);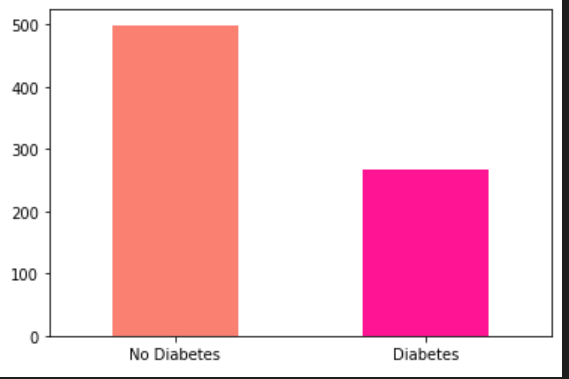
# Comparing Glucose with the Outcome
pd.crosstab(data.Glucose[::15],data.Outcome).plot(kind="bar",figsize=(18,8),color=["yellow","deeppink"])
plt.ylabel("people");
plt.xticks(rotation=0);
plt.legend(['No Diabetes', 'Diabetes']);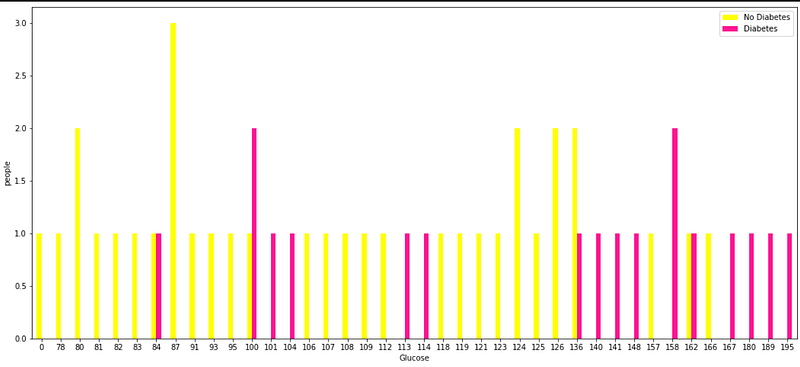
#find out Blood Pressure and age of entries who have diabetes
plt.figure(figsize=(10,6))
# Scatter with positive example
plt.scatter(data.Age[data.Outcome==1],data.BloodPressure[data.Outcome==1],c="Red");# Scatter with negative example
plt.scatter(data.Age[data.Outcome==0],data.BloodPressure[data.Outcome==0],c="lightblue");# Add some helpful info
plt.title("Diabetes in function of Age and Blood pressure")
plt.xlabel("Age")
plt.ylabel("Blood Pressure")
plt.legend(["Diabetes","No Diabetes"]);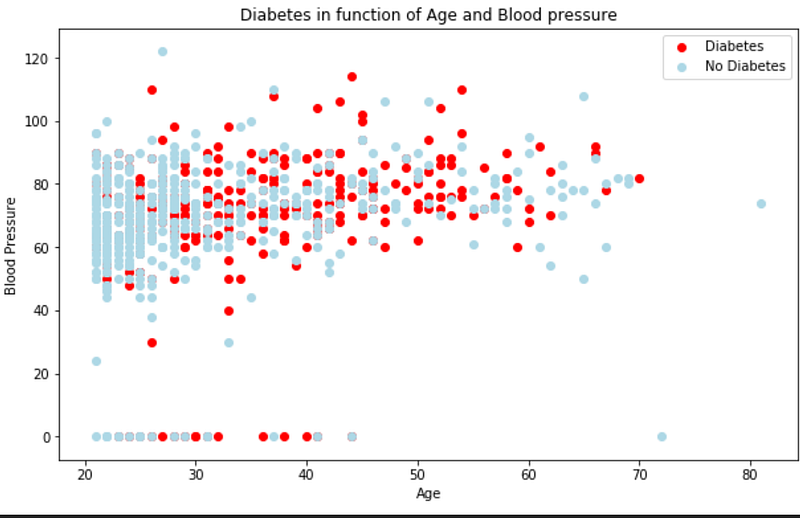
## Pairplotting of dataframe
import seaborn as sns
sns.set(style="ticks", color_codes=True)
sns.pairplot(data,hue='Outcome',palette='gnuplot');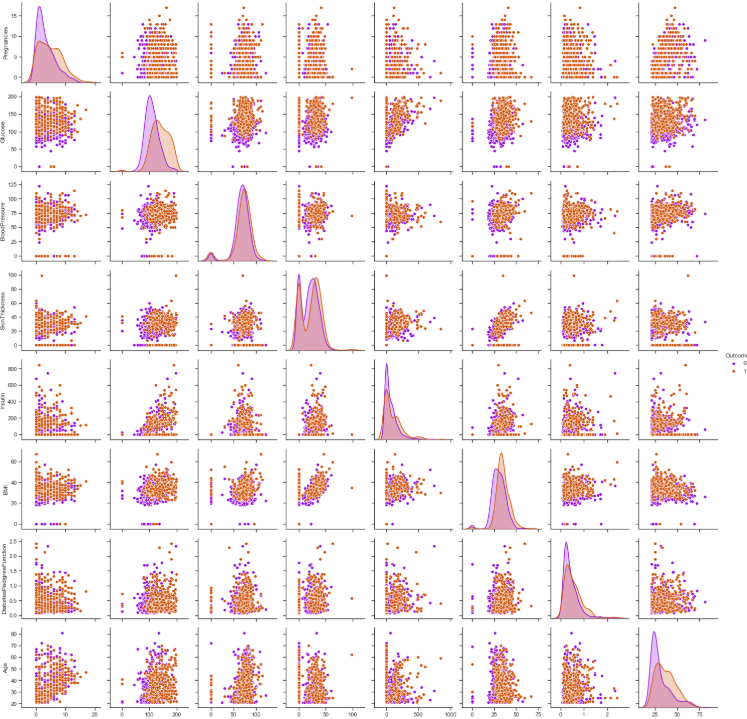
# Histogram of all coloumns when the Outcome is 1( has Diabetes)fig, ax = plt.subplots(nrows=4, ncols=2, figsize=(12, 10))
fig.tight_layout(pad=3.0)
ax[0,0].set_title('Glucose')
ax[0,0].hist(data.Glucose[data.Outcome==1]);
ax[0,1].set_title('Pregnancies')
ax[0,1].hist(data.Pregnancies[data.Outcome==1]);
ax[1,0].set_title('Age')
ax[1,0].hist(data.Age[data.Outcome==1]);
ax[1,1].set_title('Blood Pressure')
ax[1,1].hist(data.BloodPressure[data.Outcome==1]);
ax[2,0].set_title('Skin Thickness')
ax[2,0].hist(data.SkinThickness[data.Outcome==1]);
ax[2,1].set_title('Insulin')
ax[2,1].hist(data.Insulin[data.Outcome==1]);
ax[3,0].set_title('BMI')
ax[3,0].hist(data.BMI[data.Outcome==1]);
ax[3,1].set_title('Diabetes Pedigree Function')
ax[3,1].hist(data.DiabetesPedigreeFunction[data.Outcome==1]);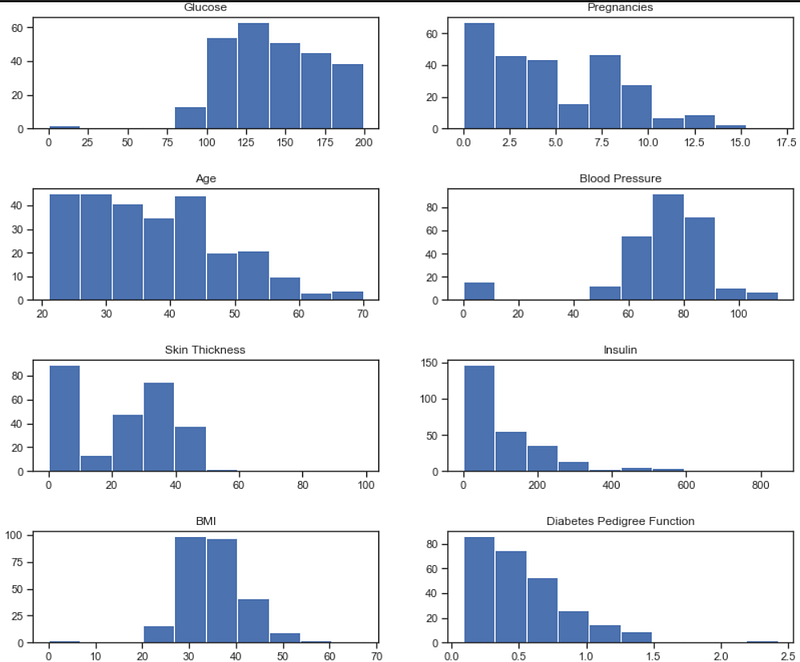
# correlation matrix between columns
## It shows the correlation(positive,neagative) between different columns(only integer value columns)
corr_matrix = data.corr()
fig,ax = plt.subplots(figsize=(15,10))ax = sns.heatmap(corr_matrix,annot=True,linewidth=0.5,fmt=".2f",cmap="YlGnBu")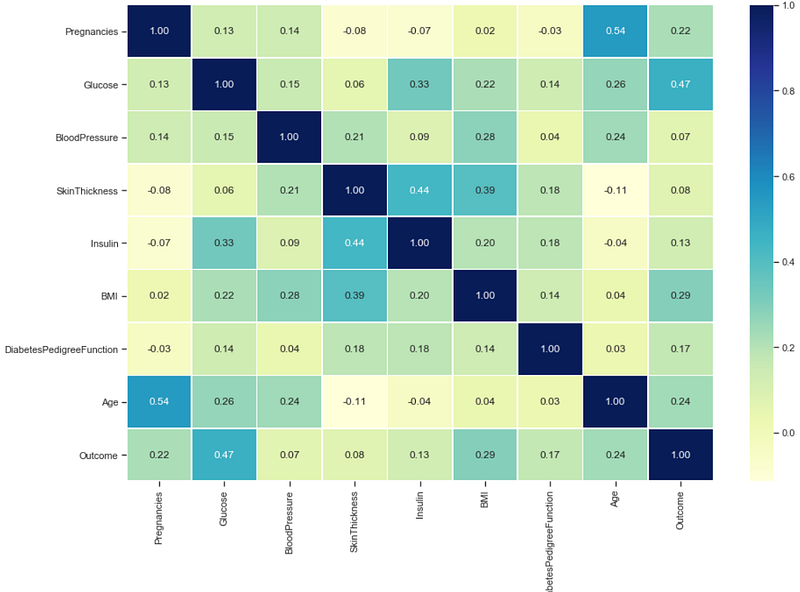
Modeling and Training
#random data shuffelindata.sample(frac=1)#Spliting the data
X = data.drop("Outcome",axis=1)
y = data["Outcome"]
X_train,X_test,y_train,y_test = train_test_split(X,y,test_size=0.2)We are going to train our model on 4 algorithms 1.Logistic Regression 2.KNN 3.Random Forest Classifier 4.Support Vector Machine
## Build an model (Logistic Regression)
from sklearn.linear_model import LogisticRegression
log_reg = LogisticRegression(random_state=0)
log_reg.fit(X_train,y_train);
## Evaluating the model
log_reg = log_reg.score(X_test,y_test)
## Build an model (KNN) knn = KNeighborsClassifier() knn.fit(X_train,y_train); ## Evaluating the model knn = knn.score(X_test,y_test)
## Build an model (Random forest classifier)
clf= RandomForestClassifier()
clf.fit(X_train,y_train);
## Evaluating the model
clf = clf.score(X_test,y_test)
## Build an model (Support Vector Machine)
svm = SVC()
svm.fit(X_train,y_train)
## Evaluating the model
svm = svm.score(X_test,y_test)
Let’s visualize the training performance of all the models
model_compare = pd.DataFrame({"Logistic Regression":log_reg,
"KNN":knn,
"Random Forest Classifier":clf,
"Support Vector Machine":svm,},
index=["accuracy"])model_compare.T.plot.bar(figsize=(15,10));##############OUTPUT###############
Logistic Regression KNN Random ForestClassifier SVM
accuracy 0.818182 0.772727 0.798701 0.818182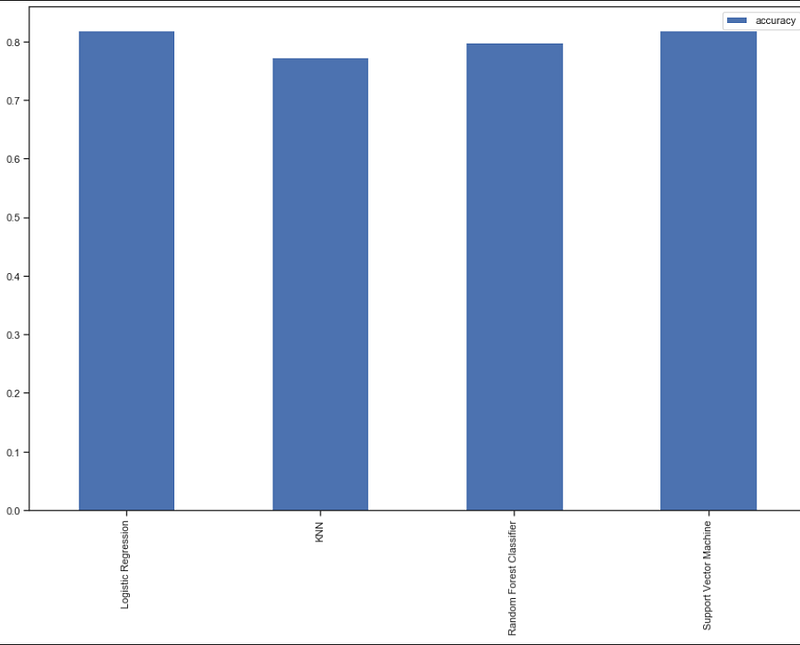
Here we can see both SVM and Logistic Regression are performing very well with an accuracy of 81%. we can improve the accuracy more using Hyperparameter tuning.
Improving accuracy using Hyperparameter tuning
We are going to use both grid search cv and RandomizedSearchcv for our hyperparameter turning.
In the logistic regression parameter which we can be easily hyper tuned are C and solver .
Hyperparameter Tuning using RandomizedSearchcv
# Create a hyperparameter grid for LogisticRegression
log_reg_grid = {"C": np.logspace(-4, 4, 20),"solver": ["liblinear"]}
# Tune LogisticRegression
np.random.seed(42)
# Setup random hyperparameter search for LogisticRegression
rs_log_reg = RandomizedSearchCV(LogisticRegression(),
param_distributions=log_reg_grid,
cv=5,
n_iter=20,
verbose=True)
# Fit random hyperparameter search model for LogisticRegression
rs_log_reg.fit(X_train, y_train)
score = rs_log_reg.score(X_test,y_test)
print(score*100)##########OUTPUT###########
83.11688311688312Great, Using Randomized Search cv we have increased the accuracy by 2%.
Hyperparameter Tuning using GridSearchcv
log_reg_grid = {'C': np.logspace(-4,4,30),"solver":["liblinear"]}
#setup the gird cv
gs_log_reg = GridSearchCV(LogisticRegression(),
param_grid=log_reg_grid,
cv=5,
verbose=True)
#fit grid search cv
gs_log_reg.fit(X_train,y_train)
score = gs_log_reg.score(X_test,y_test)
print(score*100)########OUTPUT#########
83.76623376623377Great, Using Grid Search CV we have increased the accuracy by up to 2.5%.
Best Model is logistic Regression with 83% accuracy
Evaluate the model
Let’s Predict X_test first
y_preds = gs_log_reg.predict(X_test)
y_preds
######OUTPUT#########
array([0, 0, 0, 0, 1, 0, 0, 0, 1, 0, 0, 1, 0, 0, 0, 0, 1, 0, 0, 1, 0,0,0, 0, 1, 0, 1, 1, 0, 0, 0, 1, 0, 0, 0, 0, 0, 0, 0, 1, 0, 0, 0, 0,0, 0, 0, 1, 0, 1, 0, 1, 0, 0, 0, 0, 0, 0, 1, 0, 0, 1, 0, 0, 0, 0,0, 0, 0, 0, 0, 0, 0, 0, 0, 0, 1, 0, 0, 0, 0, 1, 0, 1, 1, 0, 1, 0,0, 1, 0, 0, 0, 0, 0, 0, 0, 0, 0, 0, 1, 0, 1, 0, 0, 0, 0, 0, 0, 0,0, 0, 0, 0, 0, 0, 1, 0, 0, 0, 0, 0, 0, 0, 0, 1, 0, 0, 0, 0, 0, 0,0, 1, 0, 0, 0, 1, 1, 0, 0, 0, 1, 0, 0, 1, 0, 0, 0, 0, 0, 1,0, 0],dtype=int64)Let see the confusion matrix, accuracy score, classification report, and roc curve.
confusion matrix
sns.set(font_scale=2)
import seaborn as sns
sns.heatmap(confusion_matrix(y_test,y_preds), annot=True,cbar=False, fmt='g')
plt.xlabel("True label")
plt.ylabel("Predicted label");
accuracy score
print(accuracy_score(y_test,y_pred))#######OUTPUT########
0.8376Classification Report
print(classification_report(y_test, y_preds))ROC Curve
plot_roc_curve(gs_log_reg,X_test,y_test)Save and Load the model
import pickle
# Save trained model to file
pickle.dump(gs_log_reg, open("Diabetes.pkl", "wb"))
loaded_model = pickle.load(open("Diabetes.pkl", "rb"))
loaded_model.predict(X_test)
loaded_model.score(X_test,y_test)#######OUTPUT########
0.83766233766233772. Creating a web app using flask and connecting it with model
So to create a web app let’s prepare a folder structure
diabetes(root)
    |____templates
            |___index.html
    |____static
            |____css
            |_____js
    |____app.py
    |_____Diabetes.pkl
Download The templates and static directory from my Github
Let’s Create app.py
Now let’s run our code onto our localhost
Open CMD and go to the root(Diabetes) folder and then run app.py using python app.py then you will see some message like this👇
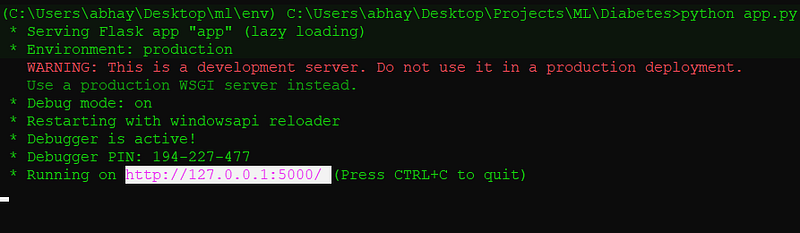
Just open the URL in any browser and test the app using some random inputs.
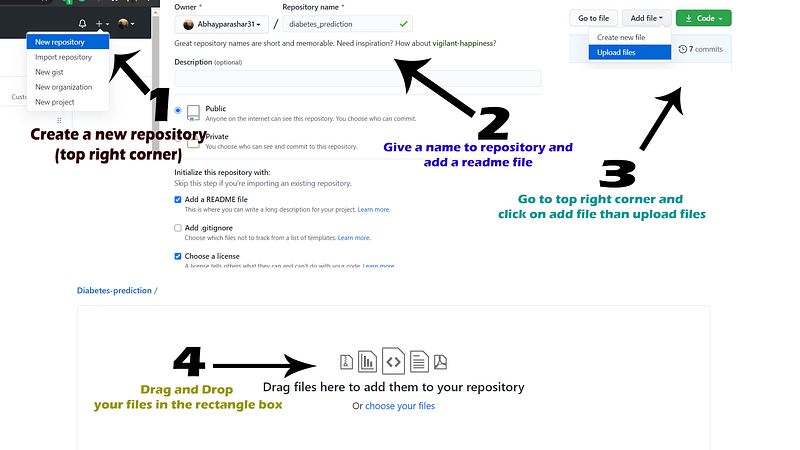
3. Commit the Projects to Github
Before committing the project to Github we also going to create two more files.
1. Profile: Heroku apps include a Procfile that specifies the commands that are executed by the app on startup.
web: gunicorn app:app2. Requirments.txt: requirements. txt file is used for specifying what python packages are required to run the project.
Flask==1.1.1
gunicorn==19.9.0
itsdangerous==1.1.0
Jinja2==2.10.1
MarkupSafe==1.1.1
Werkzeug==0.15.5
numpy>=1.9.2
scipy>=0.15.1
scikit-learn>=0.18
matplotlib>=1.4.3
pandas>=0.19
Now after that, go to your Github account and upload the files and then commit to the branch.
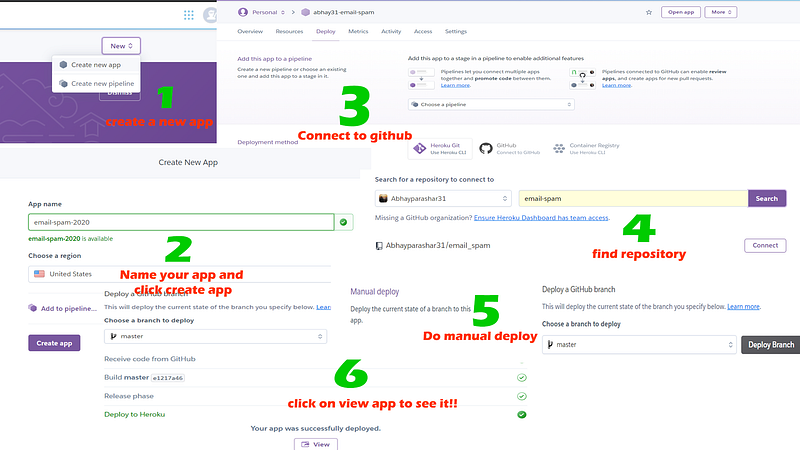
4. Deploy model using Heroku
Visit Heroku and create a free account and then log in to your account.
You can Find all the Source Code in my Github profile Abhayparashar31
Thanks, For reading😄
Thanks For Reading Till Here, If You Like My Content and Want To Support Me The Best Way is —
- Follow Me On Medium.
- Connect With Me On LinkedIn.
- Become a Medium Member With The Cost of One Pizza Using My Referral Link. a small part of your membership fee will go to me.
- Subscribe To My Email List To Never Miss An Article From Me.


