
Build a Python Treemap Visualization by Using Squarify, Matplotlib & Seaborn
A tutorial on building a Python treemap visualization by using Squarify, Matplotlib, and Seaborn.

Install the library
pip install squarify matplotlib seabornOnce the installation is complete, open your Python IDE and import the library:
import squarify
import matplotlib.pyplot as plt
import seaborn as sns
If you do not encounter any error when importing the library, you’ve successfully installed and imported the Squarify library in Python. Now, you can move on to visualizing a treemap in Python.
Create a Treemap
import squarify
import matplotlib.pyplot as plt
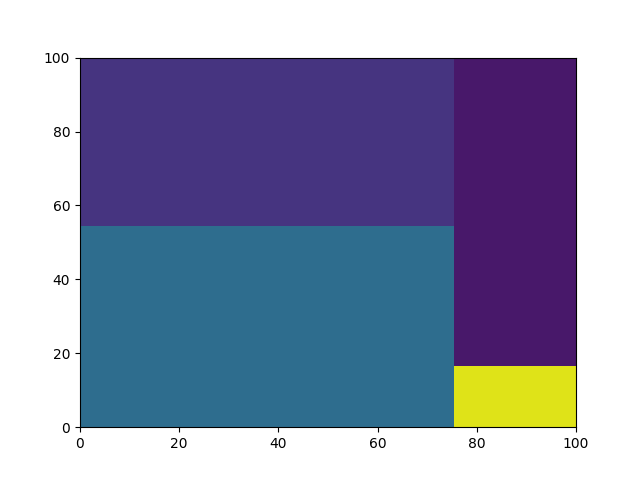
squarify.plot(sizes=[60, 50, 6, 30])
plt.show()output
Note that every time you re-run the code, you will get different colors for your plot. So, to fix the color map of your plot, please make sure to use the color parameter in the plot() method. You can pass a list of colors in the color parameter as shown below,
import squarify

import matplotlib.pyplot as plt


squarify.plot(sizes=[60, 50, 6, 30], color=["Red", "Blue", "Yellow", "Green"])

plt.show()
output

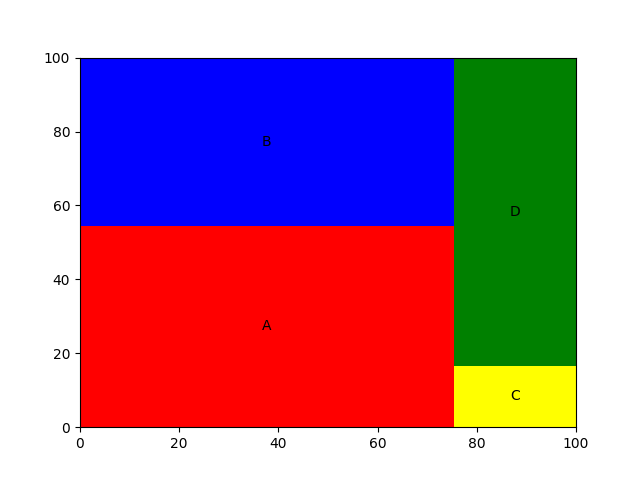
You can also assign different labels to the rectangles in your plot by using the label parameter in the plot() method. To do this, simply pass in a list of labels in the label parameter as shown below,
import squarify

import matplotlib.pyplot as plt


squarify.plot(sizes=[60, 50, 6, 30], color=["Red", "Blue", "Yellow", "Green"], label=["A", "B", "C", "D"])

plt.show()
output
Plotting a Python Treemap using the Seaborn library
If you do not have the library already installed, you can install it in your command terminal.
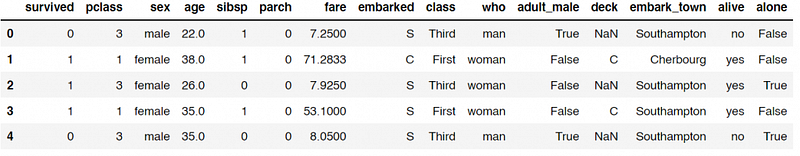
pip install seabornNow, let us start off by reading the Titanic dataset using the seaborn library
import seaborn as snsimport matplotlib.pyplot as plttitanic = sns.load_dataset('titanic')titanic.head()output
References:
https://www.theclickreader.com/python-treemap-plot-a-treemap-using-python/
https://github.com/laserson/squarify
Thanks for reading!
More content at PlainEnglish.io. Sign up for our free weekly newsletter. Follow us on Twitter and LinkedIn. Check out our Community Discord and join our Talent Collective.


