
A Practical Timeline for Streamlit
The details you need to create a package for a Streamlit component. An example for a timeline visualization!
Streamlit is a Python library that let’s you build and share data apps in a fast way. You can turn data scripts into shareable web apps, with no front-end experience required.
TimelineJS is an open-source JavaScript tool that enables anyone to build visually rich, interactive timelines. It is a project from the Northwestern University Knight Lab.
Why?
By wrapping the one into the other, it will be easy to create a timeline for everyone. Streamlit has specially developed the component structure for this purpose. The JavaScript and HTML code can be wrapped into a Python package that can be easily rendered in any Streamlit app.
Understanding TimelineJS
TimelineJS has the option to feed it Google spreadsheets. To be able to write code to dynamically create or update the timeline we will load JSON into the timeline tool. You have to follow the JSON-format. Below an example:
Things you need to include to embed a timeline:
- A link tag loading the Timeline CSS.
- A script tag loading the Timeline javascript.
- A second script tag which creates a Timeline. Here you include the JSON data from above. There are also some additional configuration options that you can use. For example, start_at_end to set the initial state of the visualization.
The resulting HTML code:
Creating the Streamlit Component
The first step in developing a Streamlit Component is deciding whether to create a static component (i.e. rendered once, controlled by Python) or to create a bi-directional component that can communicate from Python to JavaScript and back.
In this case it will be a static component that will render HTML code from above
Building the Python Package
First organise your files. You can look at the timeline-package for more details. You also have to create an account on pypi.org. This is the Python Package Index (PyPi) where you can upload, manage, find and install your package.

Now you are ready to build your python package and upload it to PyPi:
Creating a Timeline
The package is now publicly available on PyPi and can be installed by anyone:
You can use the package in your Streamlit-app:
And you can run the timeline app:
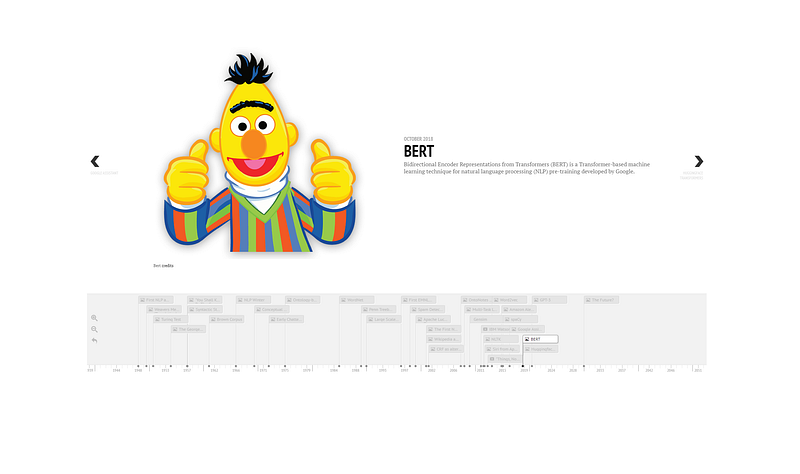
Visit the demo!
Promote your work
Feel free to connect with me on LinkedIn, Twitter/innerdoc_nlp or follow me here on Medium.


