
Build a kick-ass Report for Trending Crypto Currencies for Free (Python)

Photo: Custom HTML report
Overview
This post is a step-by-step tutorial to show you how to automatically generate a report for trending crypto currencies that contains all the info you need to make a quick trading decision.
This story is solely for general information purposes, and should not be relied upon for trading recommendations or financial advice. Source code and information is provided for educational purposes only, and should not be relied upon to make an investment decision. Please review my full cautionary guidance before continuing.
The report contains useful information about the coin, such as name, description, links, ranking, social media handles and Candlestick graphs for day and month periods.
This report uses free trending crypto and price information from the CoinGecko API. You don’t even need to sign up for an API Key.
The report can be automatically generated in certain time interval and provide html output as part of a trading system or in standalone mode.
The code can easily be modified to create a report for any coin, you would just have to look up the CoinGecko coin id first.
For more premium content, check out my Substack blog ‘The Algorithmic Trading Blog’.
The Trending Crypto Report
The report uses trending crypto currency information from CoinGecko and uses it to fetch additional information about the coin, such as:
- Name
- Description
- Links (e.g. homepage, blockchain site, announcement url)
- Social Media Links (e.g. Fackebook, Twitter)
- Sentiment
- Ranks (e.g. market cap, CoinGecko)
- Day and Month Period Candlestick Charts.
You can see a complete sample report on my GitHub repository here.
Here is a quick screenshot of the report for Terra Luna:
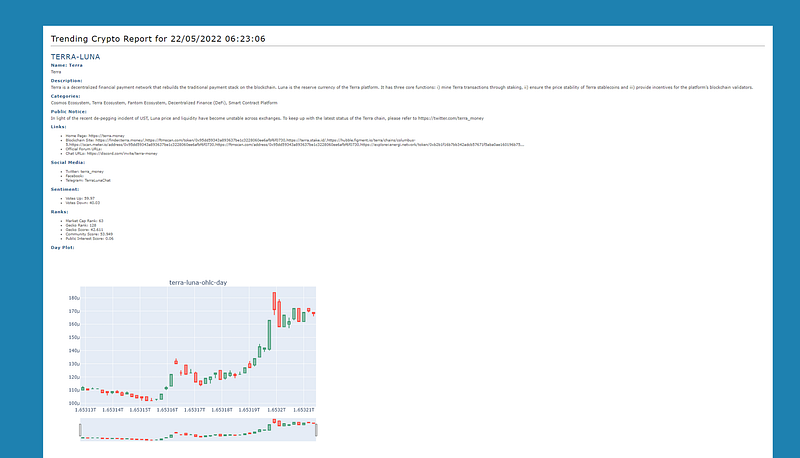
Photo: Custom HTML report
Implementation
Here the link to the official CoinGeck API documentation.
We will be using an unofficial CoinGecko client for Python called ‘coingecko’. Here the GitHub documentation for the library.
To generate the HTML page we will be using the Python library Yattag and the docs can be found here.
You can find the complete implementation as a Jupyter Notebook on my GitHub repository here.
First, we will have to import the required Python libraries:
from datetime import datetime
import sys
import os
import math
import numpy as np
import pandas as pd
import pandas_ta as ta
import datetime
from pandas.tseries.holiday import USFederalHolidayCalendar
from pandas.tseries.offsets import CustomBusinessDay
US_BUSINESS_DAY = CustomBusinessDay(calendar=USFederalHolidayCalendar())
import matplotlib.pyplot as plt
import plotly.graph_objects as go
from plotly.subplots import make_subplots
import itertools
import matplotlib.dates as mpl_dates
import yfinance as yf
from os.path import exists
from pycoingecko import CoinGeckoAPI
from IPython import display
import time
from yattag import Doc
The next function fetches the trending results from CoinGecko and parses the JSON:
def get_trending_results(cg):
    results_df = pd.DataFrame()
    response = cg.get_search_trending()
    trending_list = response['coins']
    for obj in trending_list:
        #  Parse trending results
        item = obj['item']
        item_row = pd.DataFrame({'id': [item['id']], 'name':[item['name']],'symbol': [item['symbol']],'market_cap_rank': [item['market_cap_rank']],'thumb': [item['thumb']]})
        results_df = pd.concat([results_df, item_row], axis=0, ignore_index=True)
    return results_df
This is the function that fetches the bulk of the coin information and parses the individual pieces of information:
def get_coin_info(cg, coin_id):
    response = cg.get_coin_by_id(coin_id)
    categories = response['categories']
    public_notice = response['public_notice']
    name = response['name']
    description = response['description']['en']
    links = response['links']
    homepage_link = links['homepage']
    blockchain_site = ",".join(links['blockchain_site'])
    official_forum_url = links['official_forum_url']
    chat_url = links['chat_url']
    announcement_url = links['announcement_url']
    twitter_screen_name = links['twitter_screen_name']
    facebook_username = links['facebook_username']
    telegram_channel_identifier = links['telegram_channel_identifier']
    subreddit_url = links['subreddit_url']
    sentiment_votes_up_percentage = response['sentiment_votes_up_percentage']
    sentiment_votes_down_percentage = response['sentiment_votes_down_percentage']
    market_cap_rank = response['market_cap_rank']
    coingecko_rank = response['coingecko_rank']
    coingecko_score = response['coingecko_score']
    community_score = response['community_score']
    liquidity_score = response['liquidity_score']
    public_interest_score = response['public_interest_score']

    row = pd.DataFrame({'id':[coin_id],'name':[name],'categories': [categories],'public_notice':[public_notice],\
                       'description': [description],'homepage_link': [homepage_link], \
                       'blockchain_site':[blockchain_site],'official_forum_url':[official_forum_url], \
                       'chat_url': [chat_url],'announcement_url':[announcement_url], \
                       'twitter_screen_name':[twitter_screen_name],'facebook_username':[facebook_username], \
                       'telegram_channel_identifier': [telegram_channel_identifier],'subreddit_url':[subreddit_url], \
                       'sentiment_votes_up_percentage':[sentiment_votes_up_percentage], \
                       'sentiment_votes_down_percentage':[sentiment_votes_down_percentage], \
                       'market_cap_rank': [market_cap_rank], \
                       'coingecko_rank': [coingecko_rank], \
                       'coingecko_score':[coingecko_score],'coingecko_score': [coingecko_score], \
                       'community_score':[community_score],'liquidity_score': [liquidity_score], \
                       'public_interest_score':[public_interest_score]})
    row = row.set_index('id')
    return row
This function fetches the Open, High, Low, Close prices for the coin from CoinGecko:
def get_ohlc(cg, coin_id, vs_currency, days):
    response = cg.get_coin_ohlc_by_id(coin_id, vs_currency="usd", days=days)

    ohlc_df = pd.DataFrame()
    for ohlc in response:
        epoch = ohlc[0]
        row = pd.DataFrame({'epoch':[ohlc[0]],'open':[ohlc[1]],'high':[ohlc[2]],'low':[ohlc[3]],'close':[ohlc[4]]})
        ohlc_df = pd.concat([ohlc_df, row], axis=0, ignore_index=True)

    return ohlc_df
This next function creates the Candlestick plot using the Plotly library for the day and month price information.
def plot_candlestick(coin_id, df, period):
    plot_info = f"{coin_id}-ohlc-{period}"
    fig = make_subplots(rows=1, cols=1, subplot_titles=[plot_info])
# Plot close price
fig.add_trace(go.Candlestick(x=df['epoch'],
open=df['open'],
high=df['high'],
low=df['low'],
close=df['close']), row = 1, col = 1)
fig.update_layout(
title={'text':'', 'x':0.5},
autosize=False,
width=800,height=600)
fig.update_yaxes(range=[0,1000000000],secondary_y=True)
fig.update_yaxes(visible=False, secondary_y=True) #hide range slider
#fig.show()
fig.write_image(f"{plot_info}.png", format="png")This function builds the HTML report using the Yattag library.
def build_report(coin_ids, info_map):
    #doc, tag, text, line = Doc().tagtext()
    doc, tag, text, line = Doc().ttl()
    now_str = datetime.datetime.now().strftime("%d/%m/%Y %H:%M:%S")

    with tag('html'):
        with tag('head'):
            with tag('style'):
                    text("""div{ width: 100%; }
                        html { margin: 0; padding: 10px; background: #1e81b0;}
                        body { font: 12px verdana, sans-serif;line-height: 1.88889; margin: 5%; background: #ffffff; padding: 1%; width: 90%; }
                        p { margin-top: 5px; text-align: justify; font: normal 0.9em verdana, sans-serif;color:#484848}
                        li { font: normal 0.8em verdana, sans-serif;color:#484848}
                        h1 { font: normal 1.8em verdana, sans-serif; letter-spacing: 1px; margin-bottom: 0; color: #063970,}
                        h2 { font: normal 1.6em verdana, sans-serif; letter-spacing: 1px; margin-bottom: 0; color: #154c79}
                        h3 { font: normal 1.6em verdana, sans-serif; letter-spacing: 1px; margin-bottom: 0; color: #154c79}
                        p.bold_text{ font: normal 0.9em verdana, sans-serif; letter-spacing: 1px; margin-bottom: 0; color: #154c79; font-weight: bold}""")
with tag('body', id = 'body'):
with tag('h1'):
text(f"Trending Crypto Report for {now_str}")
with tag('hr'):
text('') for coin_id in coin_ids:
coin_df = info_map[coin_id]
with tag('h2'):
text(f"{coin_id.upper()}")
with tag('div'):
line('p',f"Name: {coin_df['name'].values[0]}",klass="bold_text")
line('p',coin_df['name'].values[0])
line('p',f"Description:",klass="bold_text")
line('p',coin_df['description'].values[0])
line('p',f"Categories:",klass="bold_text")
category_list = ""
if coin_df['categories'].values[0] is not None:
for category_str in coin_df['categories'].values[0]:
if category_str is None:
continue
if len(category_list) > 0:
category_list += ", "
category_list += category_str
line('p',f"{category_list}")
line('p',f"Public Notice:",klass="bold_text")
line('p',f"{coin_df['public_notice'].values[0]}")
line('p',f"Links:",klass="bold_text")
with tag('ul', id='links-list'):
url_list = ""
if coin_df['homepage_link'].values[0] is not None:
for link_str in coin_df['homepage_link'].values[0]:
url_list += link_str
line('li', f"Home Page: {url_list}")
line('li', f"Blockchain Site: {coin_df['blockchain_site'].values[0]}")
url_list = ""
if coin_df['official_forum_url'].values[0] is not None:
for link_str in coin_df['official_forum_url'].values[0]:
url_list += link_str
line('li', f"Official Forum URLs: {url_list}")
url_list = ""
if coin_df['chat_url'].values[0] is not None:
for link_str in coin_df['chat_url'].values[0]:
url_list += link_str
line('li', f"Chat URLs: {url_list}")
line('p',f"Social Media:",klass="bold_text")
with tag('ul', id='social-list'):
line('li', f"Twitter: {coin_df['twitter_screen_name'].values[0]}")
line('li', f"Facebook: {coin_df['facebook_username'].values[0]}")
line('li', f"Telegram: {coin_df['telegram_channel_identifier'].values[0]}")
line('p',f"Sentiment:",klass="bold_text")
with tag('ul', id='sentiment-list'):
line('li', f"Votes Up: {coin_df['sentiment_votes_up_percentage'].values[0]}")
line('li', f"Votes Down: {coin_df['sentiment_votes_down_percentage'].values[0]}")
line('p',f"Ranks:",klass="bold_text")
with tag('ul', id='sentiment-list'):
line('li', f"Market Cap Rank: {coin_df['market_cap_rank'].values[0]}")
line('li', f"Gecko Rank: {coin_df['coingecko_rank'].values[0]}")
line('li', f"Gecko Score: {coin_df['coingecko_score'].values[0]}")
line('li', f"Community Score: {coin_df['community_score'].values[0]}")
line('li', f"Public Interest Score: {coin_df['public_interest_score'].values[0]}")
with tag('div', id='photo-container'):
line('p',f"Day Plot:",klass="bold_text")
doc.stag('img', src=f"{coin_id}-ohlc-day.png", klass="day_plot")
line('p',f"Month Plot:",klass="bold_text")
doc.stag('img', src=f"{coin_id}-ohlc-month.png", klass="day_plot")
with tag('hr'):
text('')
    #  Save report
    report_file = open("trending-coins-report.html", "w")
    report_file.write(doc.getvalue() )
    report_file.close()
The last function is the main() function, which
- Initializes the CoinGecko API client
- Fetches the trending coins
- Iterates the through the coins
- Fetches coin info
- Retrieves OHLC price info for the day period
- Retrieves OHLC price info for the month period
- Creates the candlestick plot files and
- build the HTML report with all the information.
#  Initialize client
cg = CoinGeckoAPI()
# Get trending crypto
results_df = get_trending_results(cg)
results_df['coin_id'] = results_df['id']
results_df = results_df.set_index('id')# Get coin info
day_ohlc_map = {}
month_ohlc_map = {}
info_map = {}
coin_ids = np.array(results_df['coin_id'])
coin_sections_html = ""
for coin_id in coin_ids:
info_df = get_coin_info(cg, coin_id)
info_map[coin_id] = info_df # Get daily prices - 30 min period
day_ohlc_df = get_ohlc(cg, coin_id, vs_currency='usd', days=1)
day_ohlc_map[coin_id] = day_ohlc_df
plot_candlestick(coin_id, day_ohlc_df, 'day')
# Get monthly prices - 4 hour period
month_ohlc_df = get_ohlc(cg, coin_id, vs_currency='usd', days=30)
month_ohlc_map[coin_id] = month_ohlc_df
plot_candlestick(coin_id, month_ohlc_df, 'month')# Build report
build_report(coin_ids, info_map)
print('Report generation complete')Wrapping Up
In this tutorial we went over the steps to build an HTML report for trending crypto currencies in Python using the information from the CoinGecko API.
You can find the complete implementation on my GitHub repo here.
If you liked this post, please clap and follow me.
You can support my writing for free using this link. Don’t miss another story — subscribe to my stories by email.
Happy trading!


