
Build a Bollinger Bands and RSI Trading Strategy Using Python
Maximizing Profits with Python: The Ultimate Bollinger Band + RSI Trading Strategy

Disclaimer: The material in this article is purely educational and should not be taken as professional investment advice. Invest & budget at your own discretion. Affiliate links are in this article (by clicking on these links you help me out with no additional cost to yourself). Please enjoy the article!
In this article I will show you how I attempted to create a profitable trading strategy using Bollinger Bands and RSI indicators with the python programming language.
If you are interested in reading more on Python one of the fastest growing programming languages that many companies and computer science departments use, then I recommend you check out the book Learning Python written by Mark Lutz’s.
What Are Bollinger Bands?
Bollinger Bands are a technical analysis tool that consists of two lines plotted two standard deviations away from a simple moving average (SMA) of a financial instrument’s price. The bands are used to measure the volatility of the price action around the SMA.
The upper band is calculated by adding two standard deviations to the SMA, while the lower band is calculated by subtracting two standard deviations from the SMA. The resulting bands create a range in which the price of the instrument is likely to stay within.
When the price of the instrument moves outside of the upper or lower band, it is considered a potential signal of an overbought or oversold condition. This may indicate a potential trend reversal or a continuation of the current trend. Traders often use Bollinger Bands in conjunction with other technical analysis tools to make trading decisions.
What is Relative Strength Index (RSI)?
RSI stands for Relative Strength Index, which is a technical analysis indicator used to measure the strength and momentum of a financial instrument’s price action.
The RSI indicator oscillates between 0 and 100 and is calculated by comparing the average gains and losses of a security over a specified time period. The RSI is plotted as a single line on a chart, with readings above 70 indicating an overbought condition, and readings below 30 indicating an oversold condition.
Traders often use the RSI indicator to identify potential trend reversals or to confirm the strength of an existing trend. For example, if the RSI is in oversold territory and begins to rise, it may indicate a potential buying opportunity as the price of the security could begin to increase. Conversely, if the RSI is in overbought territory and begins to decline, it may indicate a potential selling opportunity as the price of the security could begin to decrease.
It is important to note that the RSI is just one tool among many in a trader’s toolbox and should be used in conjunction with other technical analysis indicators and fundamental analysis to make trading decisions.
The Strategy
The strategy in this article is simple. The idea is to buy an asset when the price of the asset goes below the lower Bollinger Band and the RSI is below 30 and sell when the asset price goes above the higher Bollinger Band and the RSI is above 70.
If price < lower Bollinger Band and RSI < 30 Then BUY If price > higher Bollinger Band and RSI > 70 Then SELL
Surprisingly, this strategy seemed to have performed better than I expected!
If you prefer not to read this article and would like a video representation of it, you can check out the YouTube Video . It will go through everything in this article with a little more detail and will help make it easy for you to start programming the code even if you don’t have the programming language Python installed on your computer. Or you can use both the article and the video as supplementary materials for learning! All of the code logic will be written in the video.
Programming
The first thing that I did to create this strategy and program was to import the libraries.
import pandas as pd
import numpy as np
import matplotlib.pyplot as plt
I then defined three functions: bollinger_bands, RSI, and strategy. The bollinger_bands function calculates the upper and lower Bollinger Bands using a 30-day moving average and standard deviation of the closing price. The RSI function calculates the Relative Strength Index using a 13-day window, which is a technical indicator used to measure the strength and momentum of the stock price. The strategy function implements a trading strategy based on the Bollinger Bands and RSI. The strategy buys when the stock price goes below the lower Bollinger Band and the RSI is less than 30, and sells when the stock price goes above the upper Bollinger Band and the RSI is greater than 70.
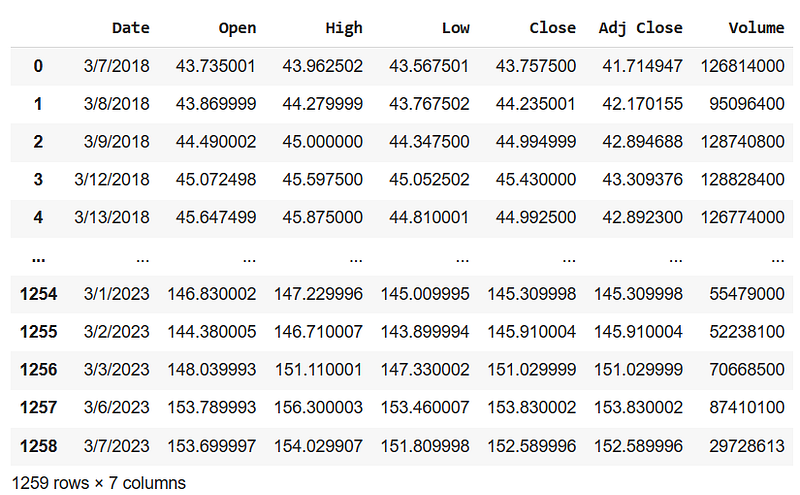
def bollinger_bands(data, window_size=30)def RSI(data, window=13)def strategy(data)After those functions were created, I then gathered stock data for the ‘AAPL’ stocker symbol (a.k.a. Apple stock) for the past 5 years.
The script or program then called the bollinger_bands and RSI functions to add the Bollinger Bands and RSI values to the data. It then calls the strategy function to get the buy and sell signals. Finally, it plots the Close price, Bollinger Bands, and trading signals using matplotlib library, and generates a chart with the results.
data = bollinger_bands(data)

data = RSI(data)

buy_price, sell_price = strategy(data)
data['Buy'] = buy_price
data['Sell'] = sell_price
The result of this trading strategy is below:
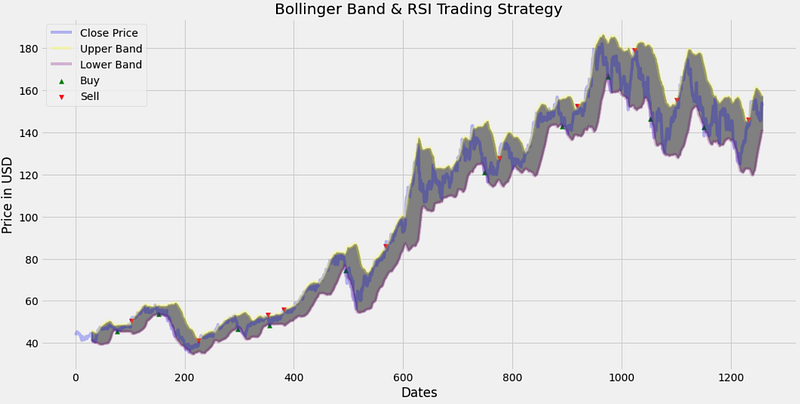
As you can see from the image above, the plot identified 9 out of 10 profitable trading periods. It did have 1 out of 10 non-profitable trades, so this lets you know that this strategy isn’t perfect, but with more data and tuning and maybe the use of other indicators this strategy can be improved upon.
Thanks for reading this article I hope it was entertaining to you all! If you enjoyed this article and found it helpful, please leave some claps to show your appreciation. If you aren’t a member of Medium already, then consider becoming a member if not for my articles, then for all of the other amazing articles & authors on this site. You can easily become a member of Medium by using the link here. Keep up the learning, and if you like finance, computer science, or programming please visit and subscribe to my YouTube channels (randerson112358 & computer science).
For more material on trading strategies using python, you can check out the book Python for Algorithmic Trading: From Idea to Cloud Deployment.
Stock Market Investing Books:
- The Bogleheads’ Guide to Investing https://amzn.to/34EJi44
- The Intelligent Investor https://amzn.to/3Lc69F0
- A Random Walk Down Wall Street https://amzn.to/3IXoS5s
Money Mindset Books:
- Rich Dad Poor Dad: https://amzn.to/34iaoyl
- Get Good With Money: Ten Simple Steps To Becoming Financially Whole: https://amzn.to/3HI8chS
Subscribe to DDIntel Here.
Visit our website here: https://www.datadriveninvestor.com
Join our network here: https://datadriveninvestor.com/collaborate


