
Breaking Down the Stock Market: How to Build an LSTM Model in Python for Accurate Price Predictions
Transforming Raw Data into Predictive Insights with LSTM Models — A Comprehensive Guide for Traders and Investors

Introduction
Stock price prediction is a popular and challenging task in finance. Investors and traders constantly seek ways to predict stock prices to make informed decisions about buying and selling stocks. One way to predict stock prices is using machine learning models, such as Long Short-Term Memory (LSTM) models. In this article, we will discuss how to use LSTM models to predict stock prices with Python, including how to download the data from Yahoo Finance using the yfinance package.
The yfinance package
The yfinance package is a popular Python library for downloading financial data from Yahoo Finance. It provides an easy-to-use interface for accessing historical stock price data and other financial information such as dividends, splits, and corporate actions. To install the yfinance package, you can use pip:
pip install yfinance
Downloading stock price data with yfinance
To download historical stock price data for a particular stock using yfinance, we need to provide the stock symbol and date range for the data we want to download. For example, to download historical stock price data for Apple (AAPL) from January 1, 2010, to March 23, 2022, we can use the following code:
import yfinance as yf

# Define the stock symbol and date range
symbol = 'AAPL'
start_date = '2010-01-01'
end_date = '2022-03-23'

# Download the stock price data
data = yf.download(symbol, start=start_date, end=end_date)

# Save the data to a CSV file
data.to_csv('AAPL.csv')
data.head()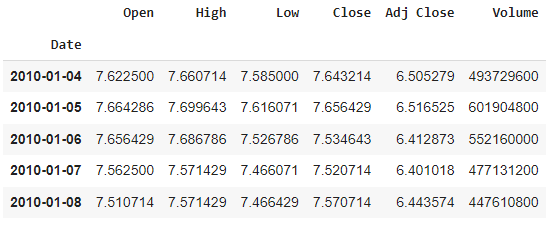
This code imports the yfinance package and defines the stock symbol and date range for the data we want to download. It then uses the yf.download() function to download the stock price data for the specified stock symbol and date range. Finally, it saves the data to a CSV file named AAPL.csv.
Preprocessing the data
Once we have downloaded the stock price data, we need to preprocess it before we can use it to train an LSTM model. The first step in preprocessing the data is to convert it to a time series. We can do this by setting the Date column of the data as the index and converting it to a datetime object:
import pandas as pd

# Load the data from the CSV file
df = pd.read_csv('AAPL.csv')

# Convert the date column to a datetime object
df['Date'] = pd.to_datetime(df['Date'])
df.set_index('Date', inplace=True)
Next, we need to normalize the data to a common scale. We can use the MinMaxScaler from the sklearn.preprocessing module to scale the data between 0 and 1:
from sklearn.preprocessing import MinMaxScaler

# Create a scaler object
scaler = MinMaxScaler()

# Fit the scaler to the data and transform the data
data = scaler.fit_transform(df['Close'].values.reshape(-1, 1))
This code creates a MinMaxScaler object and fits it to the Close column of the data. It then transforms the data to a scaled version between 0 and 1.
Creating sequences of data
To train an LSTM model to predict stock prices, we need to create sequences of data. Each sequence will consist of a specified number of time steps (or lookback window) of the stock prices, and the target value will be the stock price at the next time step. We can create sequences of data using the following function:
import numpy as np

def create_sequences(data, lookback=60):
    X, y = [], []
    for i in range(len(data)-lookback-1):
        X.append(data[i:(i+lookback), 0])
        y.append(data[i+lookback, 0])
    return np.array(X), np.array(y)
This function takes in the scaled data and a lookback window (defaulting to 60-time steps) and returns two arrays: X, which contains the sequences of stock prices, and y, which contains the corresponding target values. Each sequence in X consists of lookback time steps of the stock prices, and the corresponding value in y is the stock price at the next time step.
Splitting the data into training and testing sets
Before we can train the LSTM model, we need to split the data into training and testing sets. We will use the first 80% of the data for training and the remaining 20% for testing. We can split the data using the following code:
train_size = int(len(data) * 0.8)
test_size = len(data) - train_size
train_data, test_data = data[0:train_size,:], data[train_size:len(data),:]
This code calculates the sizes of the training and testing sets based on the length of the data and then splits the data into two sets.
Training the LSTM model
Now that we have preprocessed the data and created sequences of data, we can train the LSTM model. We will use the Keras library to define and train the model. Here is an example code to define the LSTM model:
from keras.models import Sequential
from keras.layers import Dense, LSTM

# Define the LSTM model
model = Sequential()
model.add(LSTM(50, input_shape=(lookback, 1)))
model.add(Dense(1))
model.compile(loss='mean_squared_error', optimizer='adam')
This code imports the Sequential Dense classes from Keras and defines an LSTM model with one hidden layer containing 50 LSTM units. The input shape of the model is (lookback, 1), which corresponds to the shape of each sequence in X. The model outputs a single value, which corresponds to the predicted stock price at the next time step. The model is compiled with the mean squared error loss function and the Adam optimization algorithm.
To train the model, we can use the following code:
# Reshape the training data to the format expected by LSTM
X_train, y_train = create_sequences(train_data, lookback)
X_train = np.reshape(X_train, (X_train.shape[0], X_train.shape[1], 1))

# Train the LSTM model
model.fit(X_train, y_train, epochs=10, batch_size=32)
This code first creates sequences of data from the training data using the create_sequences() function. It then reshapes the training data to the format expected by the LSTM model. Finally, it trains the model for 10 epochs with a batch size of 32.
Evaluating the LSTM model
Once we have trained the LSTM model, we can evaluate its performance on the testing set. We can use the following code to create sequences of data from the testing set and evaluate the model:
# Create sequences of data from the testing set
X_test, y_test = create_sequences(test_data, lookback)
X_test = np.reshape(X_test, (X_test.shape[0], X_test.shape[1], 1))

#Make predictions on the testing set
y_pred = model.predict(X_test)

#Inverse transform the predicted and actual values
y_pred = scaler.inverse_transform(y_pred)
y_test = scaler.inverse_transform([y_test])

#Calculate the root mean squared error
rmse = np.sqrt(np.mean((y_pred - y_test)**2))
This code creates sequences of data from the testing set using the `create_sequences()` function and reshapes the data to the format expected by the LSTM model. It then uses the model to make predictions on the testing set. Finally, it inverses scales the predicted and actual values using the `scaler` object and calculates the root mean squared error (RMSE) between the predicted and actual values.
The RMSE gives us an indication of how well the model is able to predict stock prices. A lower RMSE indicates better performance. We can use the following code to plot the predicted and actual stock prices:
import matplotlib.pyplot as plt

#Plot the predicted and actual stock prices
plt.plot(y_test.reshape(-1), label='Actual')
plt.plot(y_pred.reshape(-1), label='Predicted')
plt.legend()
plt.show()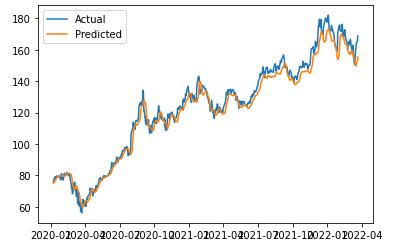
This code uses the `matplotlib` library to plot the predicted and actual stock prices. The plot should give us an idea of how well the model is able to predict stock prices.
Conclusion
In this article, we have learned how to create an LSTM model from scratch to predict stock prices. We first downloaded the stock price data using the `yfinance` library and preprocessed the data by scaling it. We then created sequences of data and split the data into training and testing sets. Finally, we defined and trained an LSTM model using the Keras library and evaluated its performance on the testing set.
LSTM models can be used for a variety of time series prediction tasks, including stock price prediction, weather forecasting, and natural language processing. By understanding the fundamentals of LSTM models and how to implement them in Python, we can apply them to a wide range of applications and make more accurate predictions.
Do subscribe to my Youtube Channel for Learning more about data Science Concepts.
Before You Go
Thanks for reading! If you want to get in touch with me, feel free to reach me at [email protected] or my LinkedIn Profile. You can view my Github profile for different data science projects and packages tutorials. Also, feel free to explore my profile and read different articles I have written related to Data Science.