Breaking Down Company Financials — A Beginner’s Guide
Understanding the financials of a company to invest in (from an Indian perspective)

This article is for those people who have already saved up some money and want to enter the stock market. By saving up I don’t mean tens of thousands or lakhs of INR. You can start with as little as 1K (or One thousand) where active mutual funds, index funds, or ETFs will be your friend and then the sky is the limit.
You might be a student who has saved up from his/her pocket money or a working person who has a running income or a business person who wants to invest some of the profit into the stock market (or other businesses to be precise) rather than putting all the profit back into the same business.
I was always curious about the concept of owning a part of a business that you understand and the sector you like. Stocks markets helped me achieve that.
But the problem with the majority of people is that rather than trying to understand a particular sector or a company, reading the financials of a company, or reading about Indian markets or the economy they trust tips more given by random strangers blabbing on tv screens.
Here we will try to discuss a few things you can analyze of a company to get started with:
Taking advantage of Tech
Rather than scrolling mindlessly through websites to find the financials of a particular company or companies of a particular sector, you can refer to some good websites that have already done the job for us either for free or for very little money.
Moneycontrol, Tickertape, Screener.in, Yahoo Finance, Economic Times, CNBC, and the list goes on…
I personally have liked Tickertape and Screener for stock analysis and money control to keep myself updated on Indian markets.
In a few clicks, you can get the most important financials of a company for the past 8–10 years. It is amazing to see and compare the financials of the company over the years on one screen.
Understanding company financials
Let’s dig deeper into the financials of India’s largest IT Services company — TCS which has a market capitalization (also called market cap.) of 12.3 Lakh crore.
Market Cap. — In easy words, It is the value of a company that is traded on the stock market and calculated by multiplying the total number of shares available by the at-present share price.
On the Tickertape platform, once you search for TCS, it will look like this.
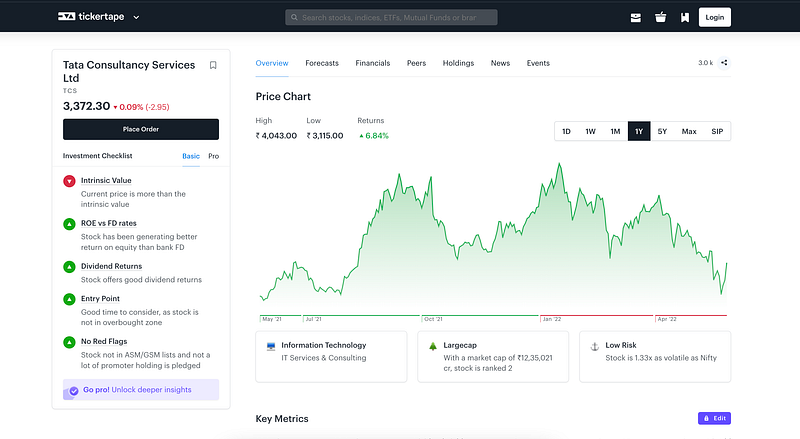
You can look at the price chart over a given period, a few key metrics concerning the industry, company profile, how peers are doing, company financials, recent news, and events, etc.
I chose TCS because it is India’s 2nd largest company in terms of market cap. after Reliance and the largest company in the IT services space is at a very good price-point as of today — 31st May 2022.
Now when a top-notch company is available at a good price point (due to a market crash or bad news of the sector or negative sentiment in the market) when is available close to its 52-week low we have to look into it. You try to build your views on top of that and finalize which stocks to hold or which ones to avoid.
My perspective for fall in TCS:
- Startup culture was on boom in the past 1–1.5 years as Indian startups got funded a lot by foreign entities. People thought startups will be the next big thing, startup took advantage of this mindset and went for IPOs to sell their holdings at premium prices. People started buying them mindlessly without looking at the financials that most of the startups were making losses and only burning investors' money. Household startup names went for IPO like Zomato, Paytm, Nykaa, etc., and got beaten down badly as time passed and people looked at the financials. The last time I checked them every single one of them was down around 30–40% from their list price.
- People thought that these big Indian giants will lose market share as startups will take over. Hence, the fall is due to the sentiment.
- The rupee fell badly to 77.6 in the past few months due to a lot of reasons including global inflation, the Russia-Ukraine war, etc. making foreign investors take out money from Indian and global markets, leading to a fall in the overall market and TCS being a part of it.
Understanding Key Metrics
Let’s look at the Key metrics of TCS.
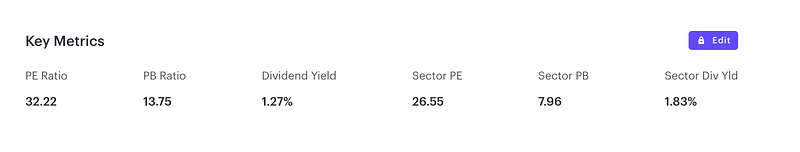
PE Ratio is basically (Price of stock)/(Earnings of the company) ratio which is at what multiple the stock price is available to its earnings.
PB Ratio is (Price of stock)/(Book value of the company) ratio which is at what multiple the stock price is available to its book value.
Similarly, we have Sector PE and Sector PB, which are similar but on average for that whole sector. In most cases, if PE and PB ratio lies within the Sector PE and PB ratio the stock is at a good price point. But measuring only PE and PB isn’t enough. Let’s move ahead to company financials now over the past 3–5 years.
Understanding Financial Trend Metrics
We have 7–8 terms here in the Financial Trend of TCS. Let’s look at them one by one and understand their meaning of them.
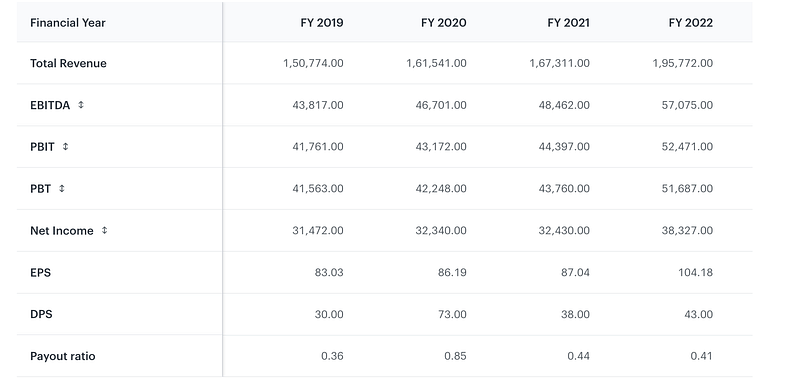
*Total Revenue says you have a business selling pens. Each pen costs 20 INR and you sold 10K pens over a particular year. So for that year, your total revenue will be 20 * 10K = 2 Lakh INR. Similarly multiplying all the revenue of your products and services sold by the price of them will land you at total revenue in a particular year.
*EBIDTA stands for earnings before interest, taxes, depreciation, and amortization. It is subtracting employee costs, administrative costs, raw material costs, fuel costs, and other random costs that are put into other expenses.
PBIT is profit before interest and taxes. In easy words it is EBIDTA but out of that depreciation and amortization of the company, assets are subtracted.
PBT is the total profit of a company by subtracting all costs but yet to pay income tax.
*Net Income is subtracting all the costs incurred by its taxes, depreciation, and amortization of company assets, fuel costs, raw material costs, etc. It is the net profit the company made after every item cost is considered.
You can have an overall view on the increase and decrease of key financial metrics, combine it with your view on the overall sector and then decide whether to shortlist it for long-term buying or not.
The best way to know more about the company's vision and its in-depth products and services you can download the latest financial report and do a selective reading.
The good thing with the screener is that gives past 7–10 years of trends on 1 screen.
Understanding Balance Sheet Metrics
Let’s try to understand a few key terms in a balance sheet — Assets, Liabilities, Equity, etc.
In simple words, assets are all those things that a company owns that help in contributing to the overall revenue or providing future benefits. Liabilities are the money you have to repay in the coming future.
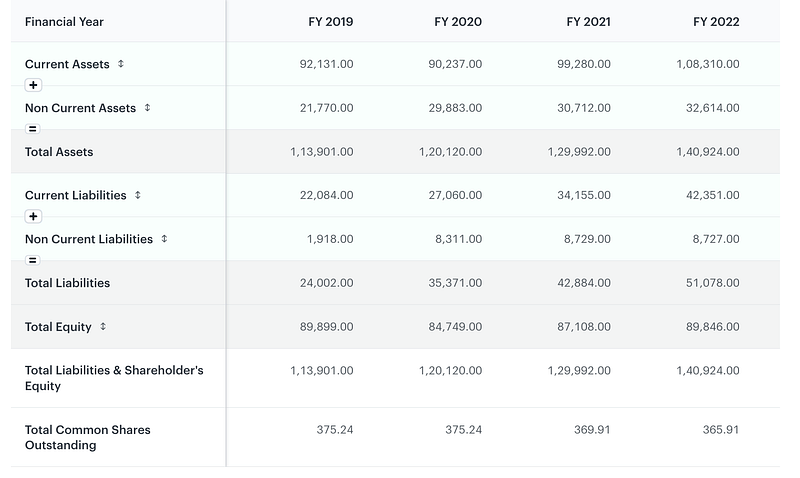
Current Assets are the properties/plants/equipment a company owns, the company's short & long-term investments, cash in hand, current inventory, and the list goes on. Similarly, liabilities are short & long-term debt, taxes to be paid, etc.
To analyze in easier terms, the assets of a good company should increase over years with manageable or a decrease in borrowings.
Total Equity of a company = Total Assets ➖ Total Liabilities
So, the overall Total Equity of a good company should also increase over time.
Note:
I generally look at a few other metrics as well including Debt to Equity ratio, PEG ratio, EPS, ROE, ROCE, YoY growth, cash on hand, the popularity of products and services, etc. which I will be writing a separate article explaining all of them.
Setting up a Demat account is very easy and will be your bridge to the stock market. I have always liked the story of Nithin Kamath and Zerodha, so all my stock investing is done via their platforms Kite (stock investing) and Coin (investing into mutual funds). Account settings, understanding a few key metrics in the terminal, and placing orders we will cover in another article.