
Box-Cox Transform for Time Series
How to create a stationary time series using the Box-Cox transformation.

Introduction
Making time series stationary is an essential part when carrying out any time series analysis or forecasting. Stationarity ensures that our data is not statistically changing through time, therefore it can more accurately resemble a probability distribution rendering it easier to model.
One requirement for stationarity is that the time series needs a constant variance. In other words, the fluctuations should be consistently on the same scale. One way to achieve this is to take the natural logarithm of the series, however this assumes that your original series follows an exponential trend. Therefore, the natural logarithm transform may not always be the best option.
In this post I want to introduce the Box-Cox transform, which is a generalistion of the natural logarithm transform. The Box-Cox allows to determine if indeed the natural logarithm is the best transform or some other power transform is more optimal.
If you want to learn more about the background and requirements of stationarity, checkout my previous article:
What is the Box-Cox Transform?
Fundamentally, the Box-Cox transforms non-normal data to more normal distribution like data.
Now you maybe wondering why do we need our time series data to resemble a normal distribution? Well, when fitting certain models, such as ARIMA, they use the maximum likelihood estimation (MLE) to determine their parameters. MLE by definition must fit against a certain distribution, which for most packages is the normal distribution.
The Box-Cox transformation is parameterised by λ (that takes real values from -5 to 5) and transforms the time series, y, as:

We see that with λ=0 it is the natural logarithm, however there are many others depending on the value λ. For example, if λ=1 there is no transform, λ=0.5 is the square root and λ=3 is the cubic transform. This is an example of a power transform.
The value λ is chosen by seeing which value best approximates the transformed data to the normal distribution. Luckily, in computing packages this is easily done for us!
The Box-Cox is a type of power transform as we are always raising our original series to some power, which is λ.
Applying the Box-Cox Transform
Let’s carry out an example to show how we can use the Box-Cox transform in Python. Below is a plot of the classic US air passenger volumes between 1948–1960 dataset:
Data sourced from Kaggle with a CC0 licence.
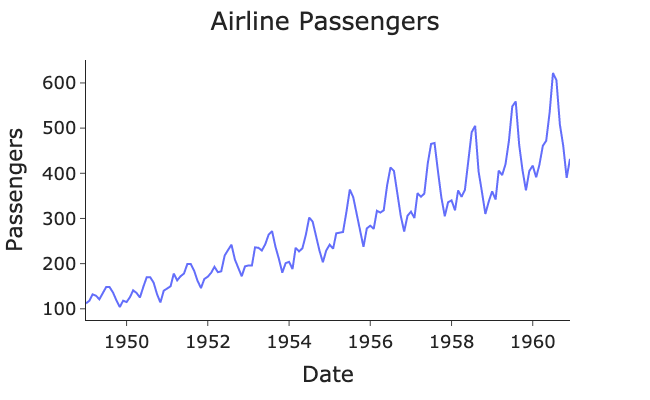
The data is clearly not stationary as the mean and variance are both increasing with time. To stabilise the variance, we can use the Box-Cox transform like we discussed above. Scipy has a function called boxcox that finds the optimal value of λ and uses it transform our data accordingly:
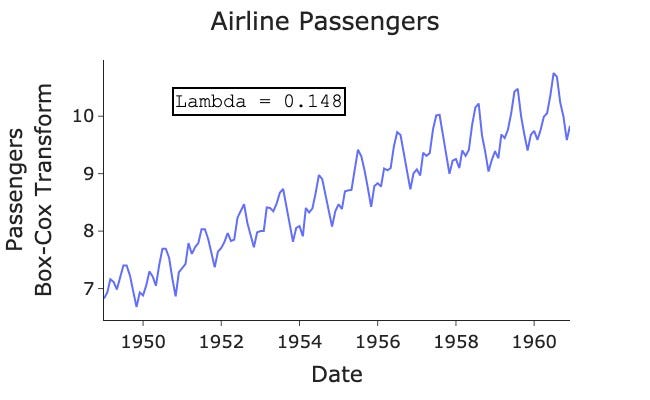
Our variance is now stable and the fluctuations are on a consistent level! The optimal λ value is 0.148, which is near a perfect natural logarithmic transform but not quite. This goes to show that the logarithm transform is not always the best approach and a more thorough method can be used through the Box-Cox transform.
Full code that was used to generate the plots and the transform can be found at my GitHub here:
Conclusion
A stable variance is one requirement for time series stationarity. Stationarity is important as it is typically required for most forecasting models. A general way of achieving a stable variance is to apply the Box-Cox transform, parametrised by λ, on your series. The transform, in Python, automatically fits the optimal value λ and transforms your series accordingly.
Another Thing!
I have a free newsletter, Dishing the Data, where I share weekly tips for becoming a better Data Scientist, and the latest AI news to keep you in the loop. There is no “fluff” or “clickbait”, just pure actionable insights from a practicing Data Scientist.
References and Further Reading
- Forecasting: Principles and Practice: https://otexts.com/fpp2/
- Box, George E. P, Cox, D. R. (1964). “An analysis of transformations”. Journal of the Royal Statistical Society, Series B. 26 (2): 211–252
Connect With Me!
(All emojis designed by OpenMoji — the open-source emoji and icon project. License: CC BY-SA 4.0)


