
Machine Learning, Recurrent Neural Networks
Bitcoin Price Prediction with LSTM using Q Blocks (Part I)
Mining Bitcoin Data. Full code available at my Github repository.
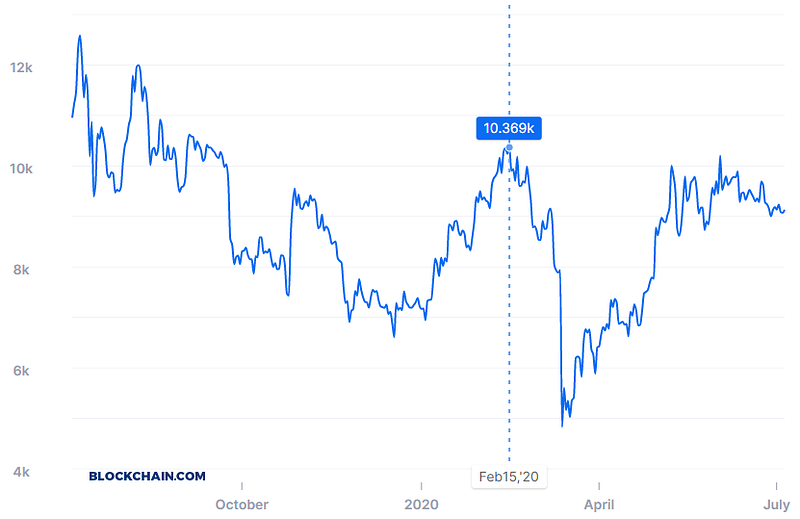
Bitcoin is a very particular asset. Its price is sensible to demand and supply rather than external factors, so it may highly depend on perceived trends rather than perceived information. For this category of problems, pattern recognition may prove incredibly useful.
Part I (this article)
Because this problem is very big, from beginning to end, I will begin with the first part of the article by Mining Bitcoin Data.
Part II (next article)
In the second part, I will be setting up LSTM to predict the upcoming Bitcoin price. Because the necessary computing power to run the code won’t be enough for a regular notebook, I will be renting computing power from Q Blocks. In the next article, I will reserve a full part on how to connect to their notebook to speed up your performances using peer to peer distributed GPU.
Part III
After having set everything to run on the Q Blocks platform, I will be explaining in detail how the LSTM model works and estimate the accuracy of the final model.
Importing Libraries
import json
import urllib.request
import pandas as pd
Importing Functions
With the following functions I will be able to decode UTF-8 data and group the data into chunks (weeks, specifically). For now, I won’t be entering into details, but with further code will require the use of those two main functions.
def group_chunks(df, id_loc, value_loc): #df, 0, 1
  def average(list1):
    sum1 = 0
    for _ in list1:
      sum1 += _
    return sum1/len(list1)
#convert DataFrame into a dict with a unique value per timestamp
mydict = {}
for x in range(len(df)):
currentid = df.iloc[x,id_loc]
currentvalue = df.iloc[x,value_loc]
mydict.setdefault(currentid, [])
mydict[currentid].append(currentvalue)
mydict#convert dict into a list
dictlist = list()
for key, value in mydict.items():
temp = [key,value]
dictlist.append(temp)#convert to DataFrame
dictlist = pd.DataFrame(dictlist)
dictlist#average of multiple values
dictlist[1] = dictlist[1].apply(lambda x : average(x))
return dictlistSpecifying initial week
The only manual intervention you will have to do in this code is to specify when the weeks have to be counted. Because I am downloading data for the last 5 years, I will specify 2015 as the initial date.
#***cambiare questa per determinare inizio conteggio settimana
benchmark_date = 2015
import datetime
def convert_week(date):
year = int(date[0:4])
return datetime.datetime.strptime(date, '%Y-%m-%d').isocalendar()[1] + (year-benchmark_date)*52
convert_week('2018-01-01')
convert_week('2019-01-01')def convert_week_back(week_n):
year_week = int(week_n/52)
year = benchmark_date + year_week
d = str(year)+'-W'+str(week_n%52)
r = datetime.datetime.strptime(d + '-1', "%Y-W%W-%w")
return rconvert_week_back(129)Downloading Function
For my experience, Bitcoin data is easily obtainable from the internet, actually from multiple sources. The issue is that most of the data have to be downloaded manually, and the rest is only available through the use of an API.
I will instruct you specifically on how to build a function that connects to https://www.blockchain.com/ to extract all the relevant data.
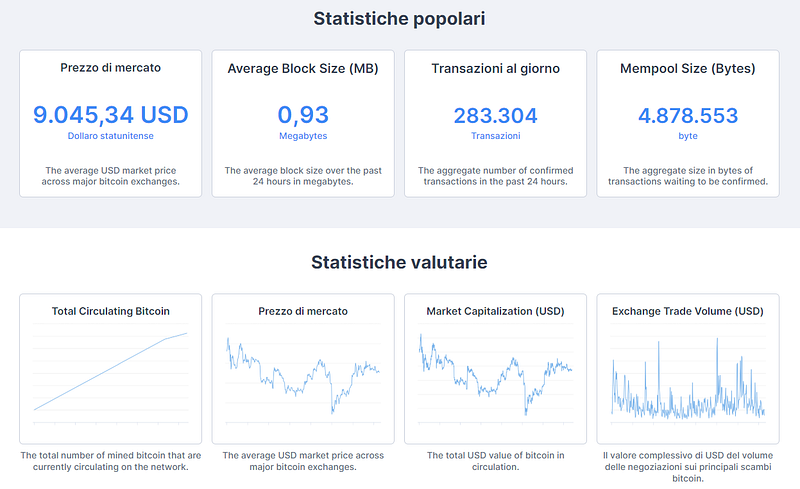
***No registration required, the data is publicly available with .json format. Therefore, you won’t be needing to make a GET request using any API Token.
Because I had to use this algorithm for a different project, it is more elaborate than what we actually need. For the LSTM I will be only using one variable (market price), while, with this function, you can automatically download and parse all of the charts available on blockchain.com.
Downloading JSON
def download_data(chart_name, data_=None, compress=True):
  #https://api.blockchain.info/charts/transactions-per-second?timespan=2years&rollingAverage=8hours&format=json
if data_ is None:
with urllib.request.urlopen('https://api.blockchain.info/charts/' + chart_name + '?timespan=5years&rollingAverage=24hours&format=json') as url:Parsing JSON
I will use the JSON library to convert it into a dictionary. I will then store each element of this dictionary into a pandas DataFrame.
response = url.read()
data = json.loads(response)
else:
data = open(data_)
data = json.load(data)
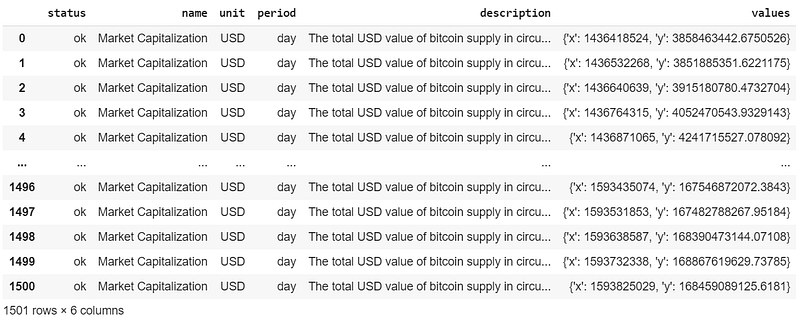
import pandas as pd
data = pd.DataFrame(data)
dataAfter the conversion into a pandas dataset, this is the result:
Extracting time and values
The data is UTF-8 encoded. I need to decode it, to extract both the timestamp and the market price (or any other value we have been downloading from the website).
#make backup
  data_copy = data.copy()
def extract_time(dict1):
dict2 = list(dict1.values())
#dict2 = list(data['values'][0].values())[0],
return dict2def time_converter(time1):
from datetime import datetime
#return datetime.fromtimestamp(time1).strftime('%Y-%m-%d %H:%M:%S')
return datetime.fromtimestamp(time1).strftime('%Y-%m-%d')#preprocessing data
data = data_copy.copy()
data['timestamp'] = data['values'].apply(lambda x : extract_time(x)[0])
data['timestamp'] = data['timestamp'].apply(lambda x : time_converter(x))
data[chart_name] = data['values'].apply(lambda x : extract_time(x)[1])
data.pop('values')
datadf = data.drop(['status', 'name', 'unit', 'period', 'description'], axis=1)
dfSo far, the function will allow me to extract data day by day. However, if I want to push it further and group it by weeks, I will need to take the average of the data within the period of time to obtain a valid metric.
if compress == True:
    #group by date
    df = group_chunks(df, 0, 1)
    #df = df.drop(df.index[[730]])
    df
#apply weeks
df['week'] = df[0].apply(lambda x : convert_week(x))
df.pop(0)
df#group by week
df = group_chunks(df, 1, 0)
dfreturn dfDownloading
As you can see, there are multiple parameters you can play with, depending on the output you wish to obtain.
Data grouped by day
market_cap = download_data('market-cap', compress=False)
market_cap.columns = ['day', 'market_cap']
market_cap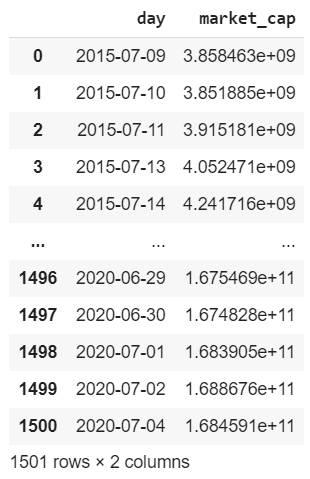
Data grouped by week
#download data compressed by week
market_cap = download_data('market-cap')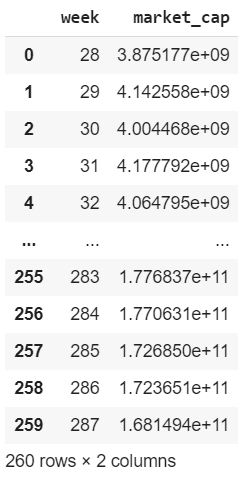
Data from downloaded JSON
Unfortunately, I found a few missing graphs from the website. Transactions Fees per USD is an example. In case you wish to download similar data, you can download directly (but manually) the son file:
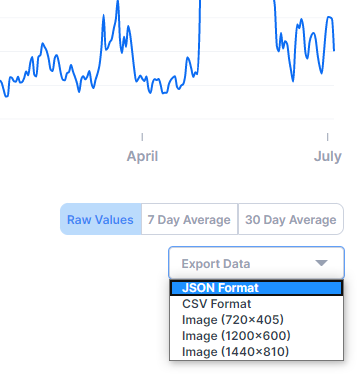
When importing it into your NoteBook, use the following setting to extract data without performing a GET request.
#importing data by json, then compressing
#transaction_fees = download_data('transaction-fees-usd') #url not working
transaction_fees = download_data(0, data_='/content/drive/My Drive/Colab Notebooks/Projects_Work/20200617_Bitcoin/fees-usd-per-transaction.json')
transaction_fees.columns = ['week', 'transaction_fees']
transaction_fees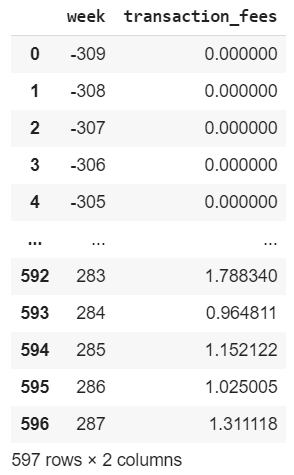
Because weeks will start counting from 2015, and I have downloaded earlier data, the week will be negative. You can delete the rows which have a negative week if you wish to discard them.
Merging Datasets
In my case, I have downloaded several different chunks of data. I will need to merge them together. I will use Weeks as a common factor that will let me group them all.
#tps, market_cap, total_bitcoins, market_price
result = pd.merge(tps, market_cap, on=0)
result = pd.merge(result, total_bitcoins, on=0)
result = pd.merge(result, market_price, on=0)
result = pd.merge(result, miners_revenue, on=0)
result = pd.merge(result, transaction_fees, on=0)
resultresult.columns = ['week', 'tps', 'market_cap', 'total_bitcoins', 'market_price', 'miners_revenue', 'transaction_fees']
result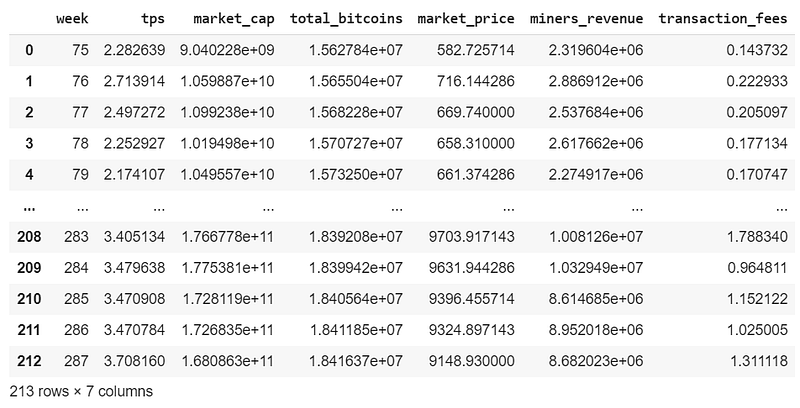
Exporting Data
market_price.to_csv('bitcoin.csv')Part II
We are all set for part II…
--> Go to part II (under construction)


