
Birthday Paradox
Probability is a fantastic and tricky subject. Some of the things that seems very rare to happen are not that rare, when analyzed with it. Some of the things that we expect to happen frequently are indeed rare occurrences. If not used used properly, probability will leave us many fallacies. The Gamblers Fallacy is one such thing. Another interesting phenomenon is the birthday paradox.

Imagine a group of ’n’ people. There may be two people within this group who share the same birthday. Since there can be 366 different values for the birthday this probability seems very low. For two people this value is 1/366. So it seems that even the number of people is high that the probability is very low. But the reality is so much different. With proper analysis it can be shown that this probability rises to 0.5 when the number of people is increased to 23. Also this probability rises to 0.99 when there are 57 people. And there is a 99.9% (Or almost sure chance) probability that two persons share a birthday among 75 people.
Equation
As in some cases, it is easier to calculate the probability of the complementary event. So we will calculate the probability that no two people have the same probability and then get the 1- that probability. For n people, the probability of the no two people having the same birthday is given as
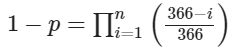
Here, we have assumed that there is an equal probability of having the birthday on any of the available 366 days (This is obviously wrong as February 29th should have 1/4th lower probability than other days. But for simplicity, lets use this assumption). From the above equation we can easily calculate our required probability.
Code
Now let’s look at the probability values for some n values.
from tabulate import tabulate

def calculate_birthday_probability(group_sizes):
    results = []
    for n in group_sizes:
        probability = 1.0
        for i in range(1, n):
            probability *= (366 - i) / 366
        results.append([n, 1 - probability])

    return results

group_sizes = list(range(1, 12)) + list(range(12,32,2)) + list(range(40,61,5))  # Range of group sizes to calculate the probability for
results = calculate_birthday_probability(group_sizes)

table_headers = ["Group Size", "Probability"]
table = tabulate(results, headers=table_headers, floatfmt=".6f", tablefmt="github")

print(table)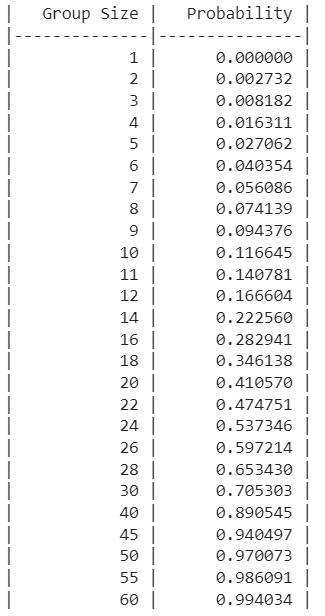
Now let’s plot the probability against the number of people n to get a better idea.
import numpy as np

group_sizes = list(range(1, 101, 2))
results = calculate_birthday_probability(group_sizes)

x_values = [result[0] for result in results]
y_values = [result[1] for result in results]

plt.plot(x_values, y_values, marker='o', linestyle='-', color='blue')

# Add lines at y-values
plt.axhline(y=0.5, color='green', linestyle='--')
plt.axhline(y=0.9, color='blue', linestyle='--')
plt.axhline(y=0.95, color='red', linestyle='--')

# Find x-intercepts using numpy's interpolation
x_intercept_05 = np.interp(0.5, y_values, x_values)
x_intercept_09 = np.interp(0.9, y_values, x_values)
x_intercept_095 = np.interp(0.95, y_values, x_values)

# Annotate the x-intercepts on the plot
plt.annotate(f'x-intercept (y=0.5): {x_intercept_05:.2f}', xy=(x_intercept_05, 0.5), xytext=(x_intercept_05, 0.4),
             arrowprops=dict(arrowstyle='->', color='black'))
plt.annotate(f'x-intercept (y=0.9): {x_intercept_09:.2f}', xy=(x_intercept_09, 0.9), xytext=(x_intercept_09, 0.8),
             arrowprops=dict(arrowstyle='->', color='black'))
plt.annotate(f'x-intercept (y=0.95): {x_intercept_095:.2f}', xy=(x_intercept_095, 0.95), xytext=(x_intercept_095-49, 1),
             arrowprops=dict(arrowstyle='->', color='black'))

plt.xlabel('Group Size')
plt.ylabel('Probability')
plt.title('Probability of Birthday Paradox')
plt.grid(True)
plt.show()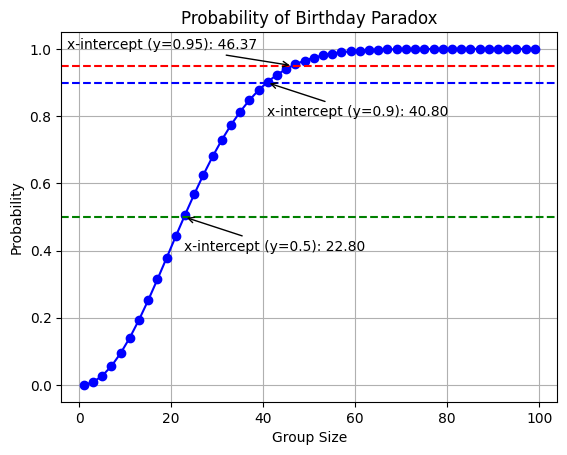
Conclusion
From the table and plot, it is evident that the probability of the birthday paradox exceeds 50% with just 23 people and surpasses 90% with only 41 people. This phenomenon showcases the remarkable nature of probability and challenges our intuitions about the likelihood of events. Understanding such probabilities can have practical implications in various fields, including statistics, cryptography, and social dynamics. By gaining insights into the intricacies of probability, we can navigate uncertainties with a more informed perspective.