
Analyzing JavaScript UI Performance Using Network Panel and HAR Files
The effective way to debug web applications

My page is slow to load! My page is stuck on loading!
Have you heard of this kind of complaint before?
The most obvious UI performance issue is the long loading time. If the webpage takes more than 2 seconds to load, it is considered a poor user experience. If it takes more than 5 seconds to load, the web application is regarded unusable.
As UI developers, we have faced this situation all the time. In a development environment, we focus on writing performant code. However, there are many factors that can cause loading issues, such as slow internet connection, out-of-date browsers, cached data and cookies, ad-blockers, browser extensions, many open tabs, or simply the states of browsers that have not been restarted for a while.
We may not know each user’s working environment. With limited access, problems can be inspected and resolved by analyzing network activities. The technique has been around for a while, and it remains one of the most effective ways to measure JavaScript performance and debug any bottlenecks.
DevTools’ Network Panel
Every browser provides DevTools. In this article, we use Chrome as an example. DevTools for other browsers work in a similar way.
By default, the Network panel records all network requests if DevTools is open.
Here is an example where the requests table shows 21 requests from http://www.qwerly.com/:
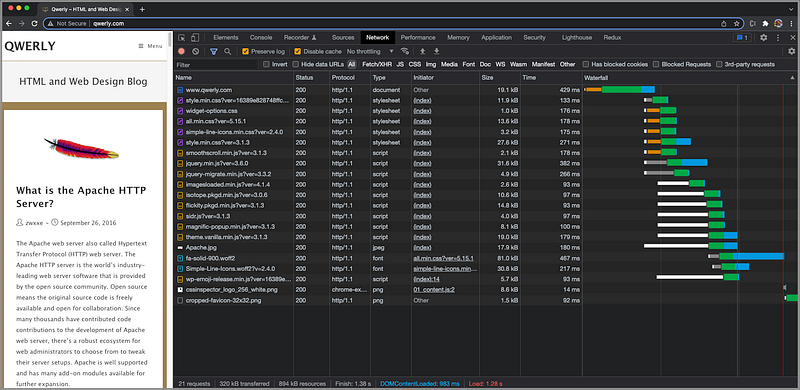
The requests table displays all requests made since DevTools is open. The requests are examined to reveal how a web application works. There are two parts about this table:
- Set up controls to record target requests.
- Analyze the saved requests.
Set up controls to record target requests
There are a number of controls to be configured on how to record target requests.
- The recording button: By default, the recording button is on, but it can be turned off. It changes to grey when DevTools is no longer recording requests.

- The clear button: It clears all requests from the requests table.

- The filter button: It shows/hides the filter panel on the next row.

When the filter button is on, we can filter the requests table by text, and the specific buttons of All, Fetch/XHR (XMLHttpRequest), JS (JavaScript), CSS. Img (Image), Media, Font, Doc (Document), WS (WebSocket), Wasm (WebAssembly), Manifest, and Other.
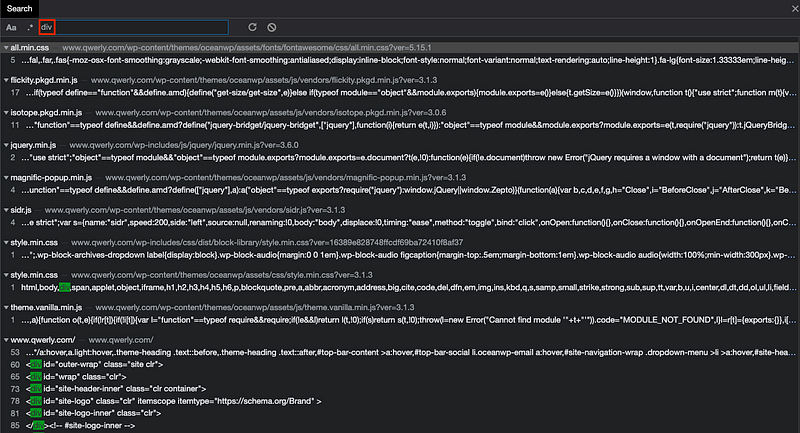
- The search button: It opens a search panel, where the response content can be searched upon.

The following is the search panel that searches for div from the requests table.
- The
Preserve logcheckbox: To save requests across page loads, check thePreserve logcheckbox. Otherwise, the requests table is cleared for each page load. For performance analysis, it is usually helpful to save requests across page loads.

- The
Disable cachecheckbox: To emulate the first-time user experience, check theDisable cachecheckbox. Otherwise, some requests are served from the browser cache on repeat visits.

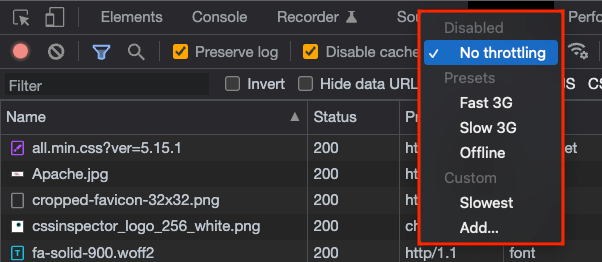
- The network throttling menu: Besides the regular network speed (
No throttling), we can emulateFast 3G,Slow 3G,Offline, and other custom connection speeds (such asSlowest).
Analyze the saved requests
We have configured the requests table to log the target requests. How do we read the requests?
The above requests table displays the following columns:
Name: The filename of, or an identifier for, the resource.Status: The HTTP status code.100–199are informational responses,200–299are successful responses,300–399are client error responses, and500–599are server error responses. Status200isOK, which means the request succeeded.Protocol: The application protocol, such ashttp/1.0,http/1.1,h2,h3, etc.Type: The MIME (Multipurpose Internet Mail Extensions) type of the requested resource, such asdocument,stylesheet,script,font,png,jpeg, etc.Initiator: The object/process that initiates request. In the above requests table, most requests are initiated by the index file.Size: The combined size of the response headers plus the response body, as delivered by the server.Time: The total duration, from the start of the request to the receipt of the final byte in the response.Waterfall: A visual breakdown of each request’s activity.
There are more columns that can be selected, and each column can be sorted.

Analyzing the saved requests can tell how an application works. It shows failed and errored calls. Errors could result from the client invoking API calls incorrectly, or the server encountering internal errors. The details can be figured out by going though the requests table line by line.
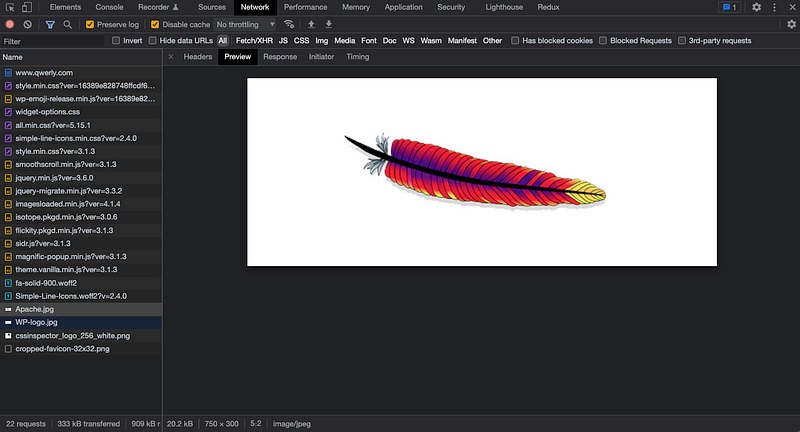
Clicking a request line will show or replay the request. The request for Apache.jpg shows a preview of a feather image.
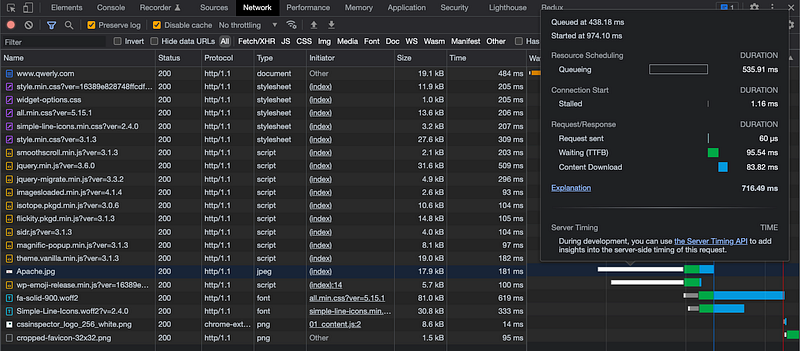
The waterfall activity shows how long a request is queued, how long it is waiting, and how long it takes to download the content.
Queueing: The browser queues requests when there are higher priority requests, or there are already 6 TCP connections open for this origin, which is the Chrome limit forHTTP/1.0andHTTP/1.1, or the browser is allocating space in the disk cache.Waiting (TTFB): The browser is waiting for the first byte of a response. TTFB stands for Time To First Byte. This timing includes 1 round trip of latency and the time the server takes to prepare the response.Content Download: The browser is receiving the response, either directly from the network or from a service worker. This value is the total amount of time spent reading the response body. Larger than expected values could indicate a slow network, or that the browser is busy performing other work, which delays the response from being read.
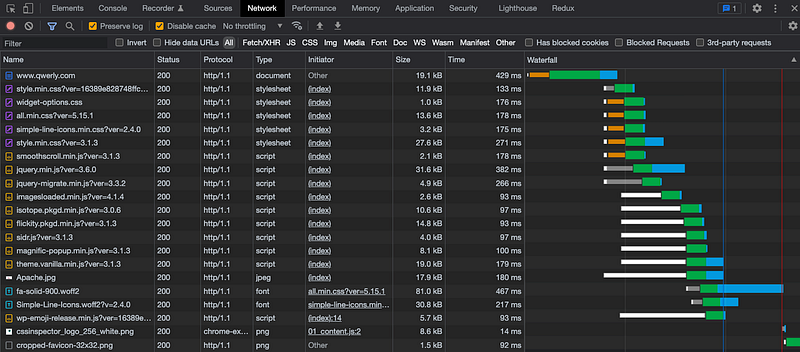
We change the throttling menu to Slow 3G. During the first 5s, the heading image is missing. What has happened?
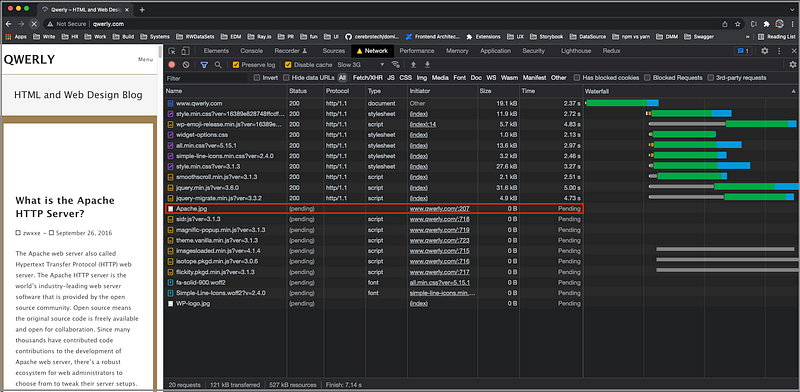
Looking into the requests table, we find out that there are multiple pending requests. The request for Apache.jpg is pending. That is the root course why the image is missing.
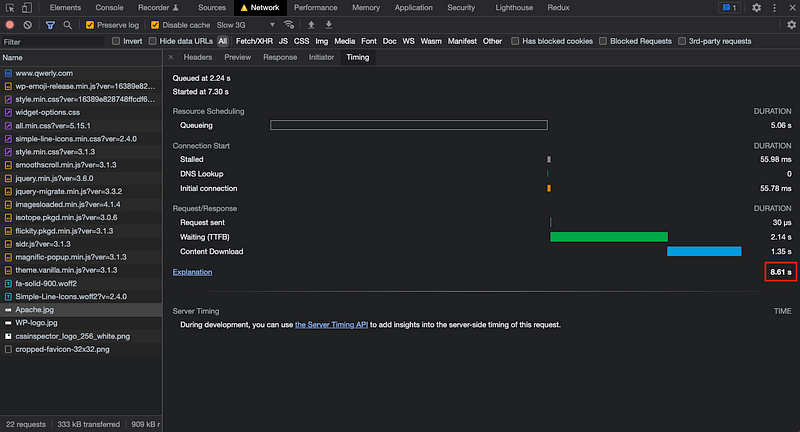
After the webpage is fully loaded, we exam the request for Apache.jpg. It has taken 8.61s to load the image from Slow 3G.
Save Network Panel Log to HAR Files
From the previous example, we have seen that the requests table is very effective to analyze UI performance issues.
http://www.qwerly.com/ is a simple page. If we try the Google Map for San Francisco, there are total 208 requests, which is not viewable in the browser viewable area. It needs more time to analyze the requests.
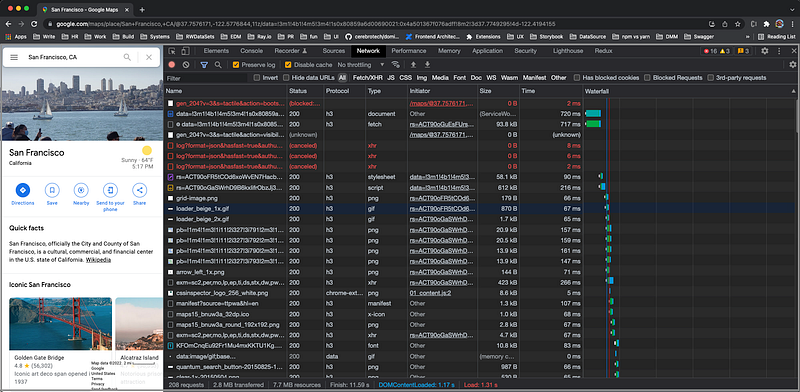
What if we accidentally close the window/tab?
Are we going to lose all request logs?
The solution is to save the requests table to a HAR file.
HAR stands for the HTTP Archive format. It is a JSON-formatted archive file format that logs how a web browser interacts with a site. The common extension for this type of file is .har.
Right clicking the requests table displays a menu. Choosing Save all as HAR with content, and the request logs are saved.
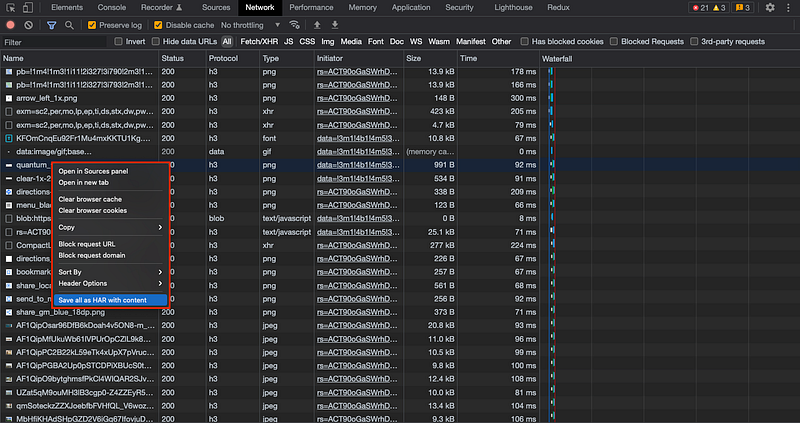
Equivalently, we can use the down arrow to save the HAR file.

View HAR Files
We have gotten requests for slow UI, and saved them to HAR files.
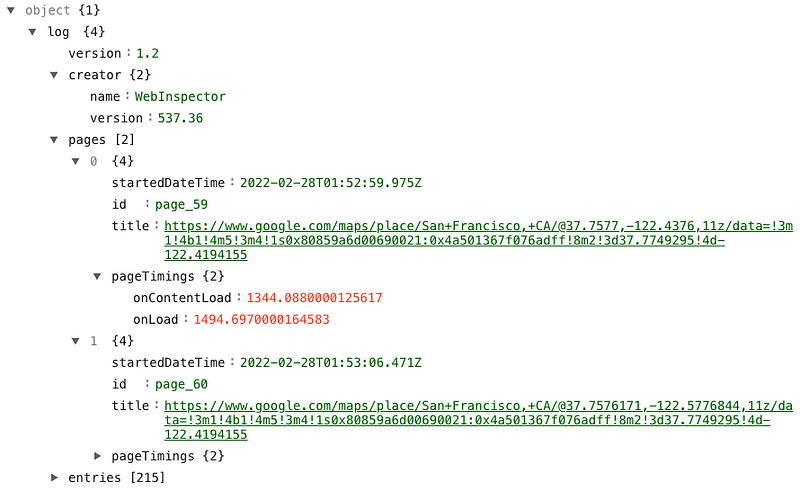
Here is an example of HAR file from the Google map:
The file has 94,816 lines, and we have shown the first 58 lines. The following is the JSON tree:
How can we analyze this HAR file?
There are a number of ways to view HAR files:
- Upload HAR files to the Network panel.
- Use the Chrome extension.
- Use online HAR file viewers.
Upload HAR files to the Network panel
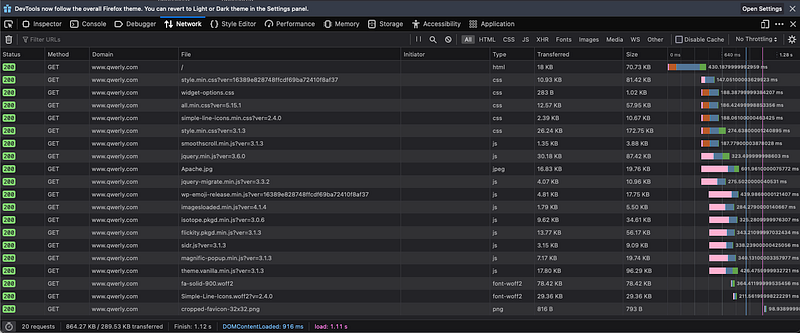
HAR files are saved from the Network panel, and they can be uploaded back to the Network panel.

This also can be accomplished by drag and drop a HAR file on the Network panel.
Here, we can even drop the HAR file saved by Chrome onto the Firefox browser.
Use the Chrome extension to view HAR files
Chrome has an extension, HTTP Archive Viewer, which is a utility to inspect HAR files.
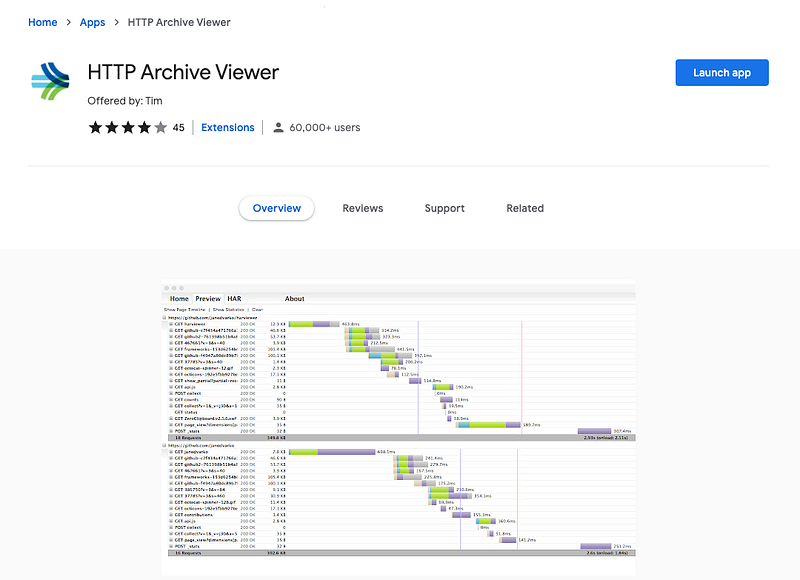
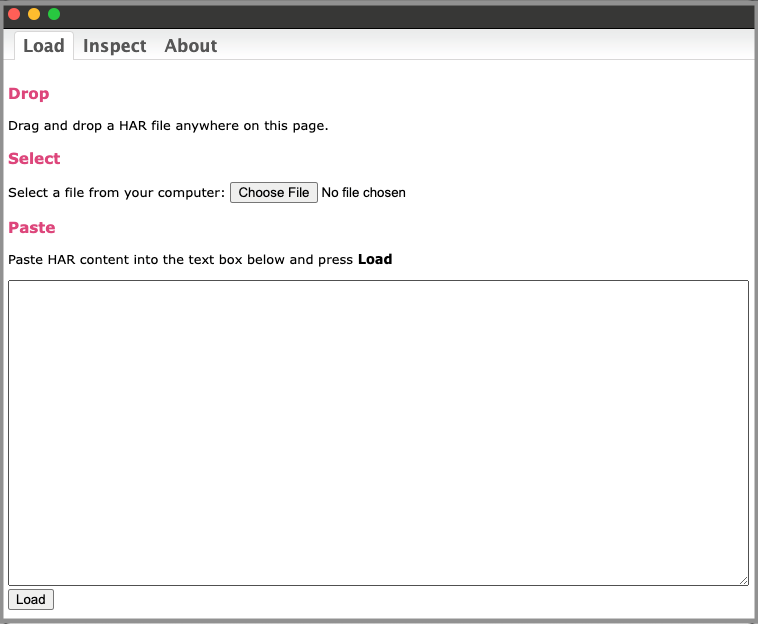
Click the Lunch app button, and it launches a pop up window, which has 3 tabs. The first tab is for loading a HAR file. The file can be dropped anywhere on the page, be chosen with the file selector, or be pasted into the text box.
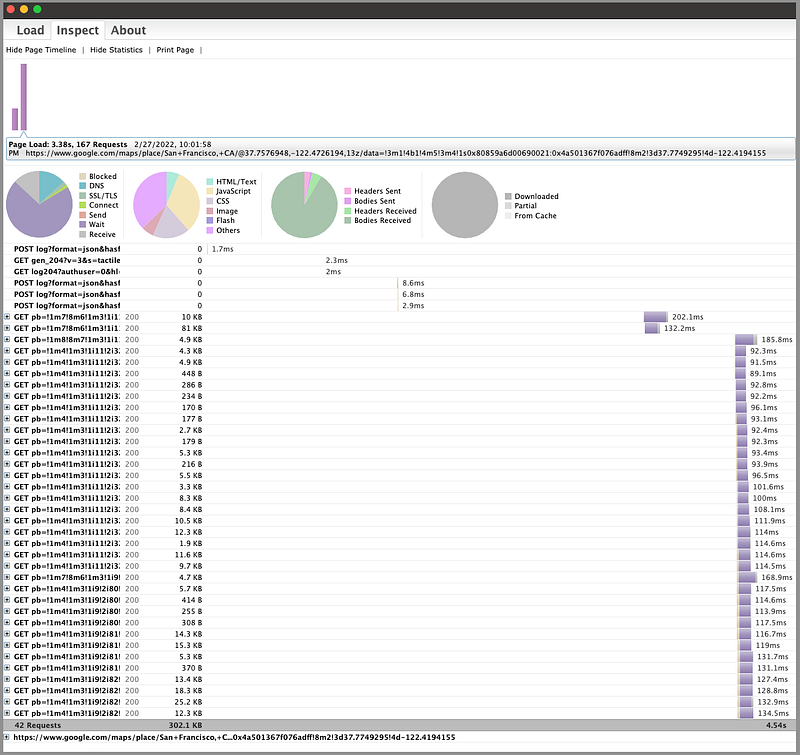
After the file is loaded, the window switches to the Inspect tab. Besides the requests that can be used for additional analysis, the viewer can also show/hide Page Timeline for each loaded HAR file. We have loaded two HAR files, one for http://www.qwerly.com/ and one for the Google map. Clicking the timeline bar can select/unselect the associated requests to be included/excluded in Show Statistics panel. In the below screenshot, both HAR files are selected to show the statistics regarding transferred data.
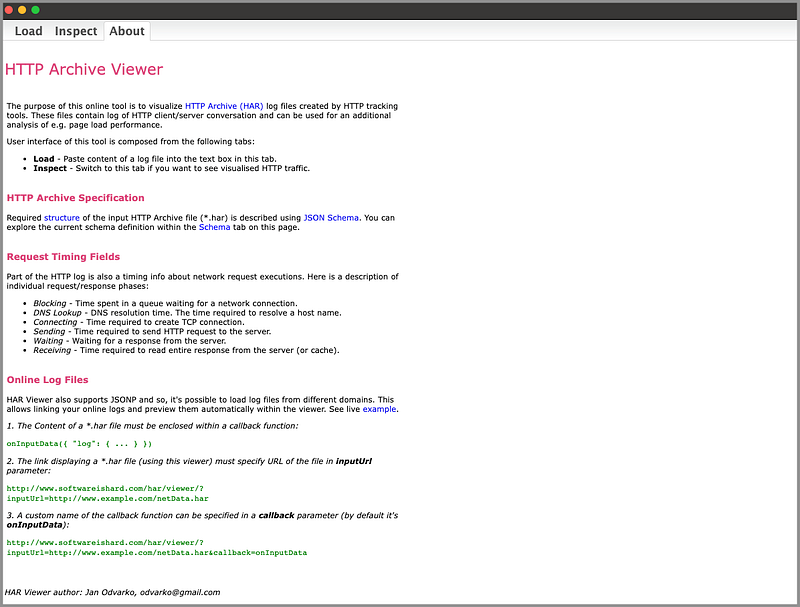
The third tab is About, which is the description about the viewer.
Use online HAR file viewers
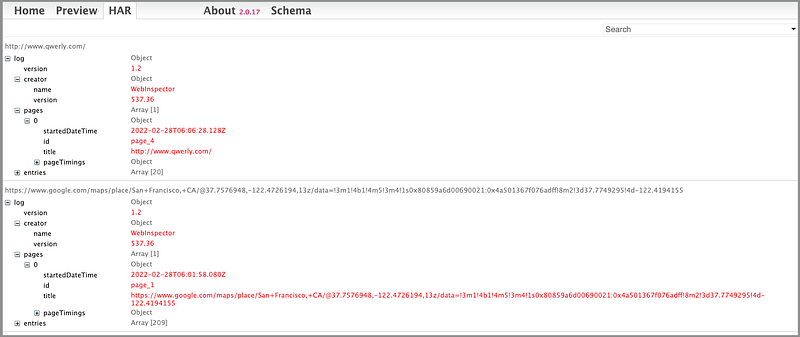
There are some online HAR file viewers, and http://www.softwareishard.com/blog/har-viewer/ works similar to Chrome extension, HTTP Archive Viewer.
The first two tabs are similar to HTTP Archive Viewer’s first two tabs. The third tab shows the JSON tree of uploaded HAR files.
Conclusion
We have shown how to use DevTools’ Network panel to analyze UI performance. The requests table can be saved as HAR files. HAR files can be uploaded back to the Network panel to be inspected, or be displayed and analyzed with browser extensions or online HAR file viewers. This technique is not new, but it remains one of the most effective ways to measure JavaScript performance and debug any bottlenecks.
Thanks for reading. I hope this was helpful. If you are interested, check out my other Medium articles.


