
Best free API for weather records: ERA5!
In my job as a data scientist, once I needed to add detailed records of weather data to my project. I wanted things like, temperature, humidity, rainfall, etc given the spacetime coordinates (time and GPS location).
I thought that finding an API that could give this type of information was going to be easy. I didn’t know that weather data are one of the most jealously kept type of data.
If you search for “free weather API”, you will see plenty of similar websites with different services that are not actually free or have no historical weather records.
I really need to search long and hard before finding the Climate Data Store (CDS) web site.
What is the CDS?
The CDS is a service provided by the EU that offers all climate records from any part of the work with an easy python program: ERA5.
The ERA5 is a reanalysis dataset model that provides hourly weather data from 1979 to 2019, free of use, no limitation on the API, and in python, BINGO!
What you need to do is to sign up to the website, copy the CDS API key and install it.
The service is so well done that you can use this page link to select what kind of data you want by selecting the period and format. Press “Show API request” and it will show the exact Python code needed to download the data. Fantastic!!!
Let’s see an example:

Example: Temperature in Cambridge, UK
I will navigate you through an example of how we can fetch weather records only for the temperature at 2 meters from the surface. As a location, we will choose Cambridge, UK, where I am located.
The Latitude/Longitude for the city of Cambridge is 52.205337/0.121817.
Let’s start by getting the temperature for the first week of April in 2019 (Monday, 01–07/04/2019).
First, we need to import the package for the API, cdsapi and the one to handle the format of file we will download netCDF4.
The numpy package to handle the data and matplotlib and seaborn to plot them:
Let’s see the function “get_weather_data” to download the data:
With the function above we can download the data and save it in a ‘.nc’ format, we’ll see what kind of input requires later:
For this example, we said we’ll use the position of Cambridge in England:
The API will find the weather data only for a rectangular area, however, we reduce to a point by using the same lat and long twice as seen in the code below:
Also the weather function requires the date, divided by year, month and day: Each value needs to be a string without abbreviation and even the single digits for days and months must have 0s in front or that will cause an error,
Now we have fetched the data and downloaded the file ‘first_week_Apr_2019.nc’ .
Wa we need now it’s to load it, with the following:
The function opens the file in format “.nc” and returns a pandas dataframe with the value of temperature and datapoint.
These are the results: Temperature in Kelvin and time expressed in hours:
We can plot them with the following code:
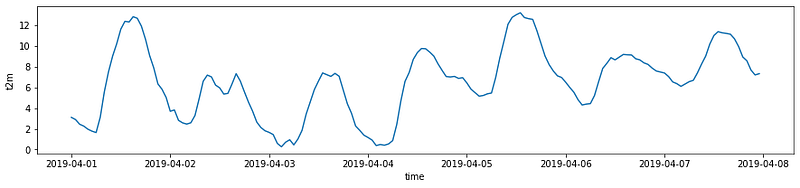
We can see, unsurprisingly, that the temperature rises during the day and then declines.
To better appreciate this phenomenon I wanted to add the moment of sunrise, noon, and sunset and I found this interesting API: https://sunrise-sunset.org/api
Using the following code in the above API.
Once the dates are obtained, we create a dataframe to fill with the moment of sunrise, sunset and solar noon (maxim elevation of the sun) for that week:
And now, we can plot it:
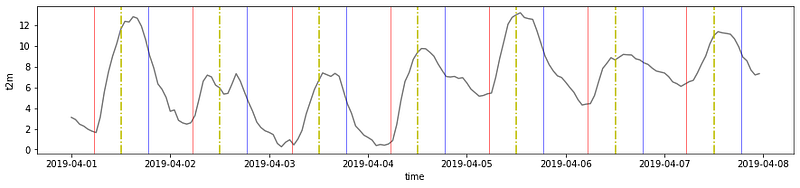
We can see that the coldest moment of the day is the moment before sunrise, the red line. The hottest moment of the day is after the solar noon (the highest position of the sun in the sky), represented by a dotted yellow line and it can last for 3–4 hours. The temperature keeps steadily passing the sunset line in blue.
Temperature for 2019
A week was fun, but can we repeat the experiment for a one year period?
If we print them:
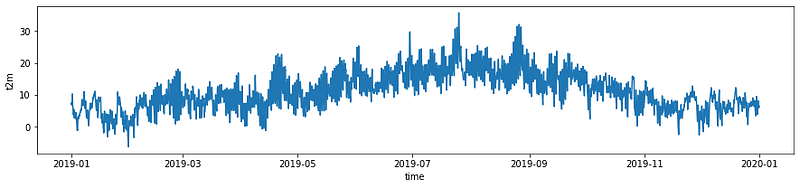
From the plot, we can see that the temperature rises until August and then declines.
There are three peaks of temperature: In April, the hottest day in August and one last peak just before September.
Temperature since 1979
The temperature behaviour for one year was interesting, but the database goes back to 1979. What would that look like?
For this type of research, it is better to not download every single day, month and year. But if you really are so inclined, I would suggest downloading one year at the time.
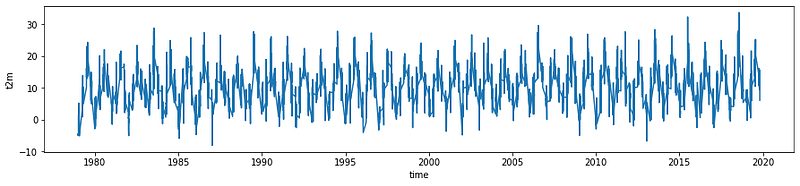
It is nice to see how the temperature oscillates.
It doesn’t seem to change in the years, but is that true? We can try to make a linear regression and see it for ourselves.
Let’s do some simple prediction
Because datatimes don’t work well with linear regression, we convert all the dates back into days and hours.
We then apply the regression:
And plot it:
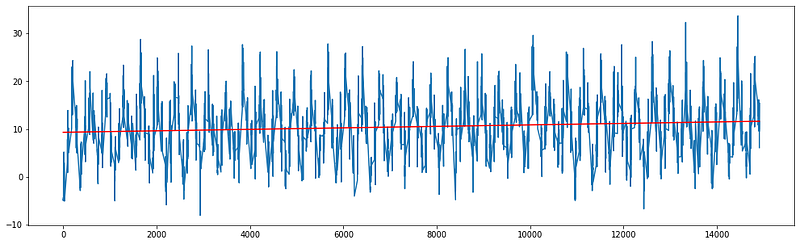
It is hard to see, but the red line is going a bit upward.
If we look at the predictions, the temperature for 2019 is 2 degrees higher than it was in 1979!
Indeed, the average temperature for 1979 and 2019 confirms,
that the temperature is rising … 2 degrees …
Predict future temperature with Random Forest Regression
Let’s step up the game and create a more complex machine learning model to predict future temperature.
The tool I choose to use is Random Forest Regressor from the popular package Sklearn.
Let’s import everything we need:
The model as a R-square of 0.73, not terrible but good enough for a quick model!
If we now use the entire database as training set:
And let’s see how the model predicts the temperature right at this moment.But before we have to convert the time and repeat what seen above:
The model has predicted a temperature of 6 degrees and there are actually 7 degrees, at the moment of my analysis. I’d not plan my holidays according to this model but not bad for a simple side project!
Conclusions:
In this article, we have seen that we can download all historical weather data and with simple machine learning tool we can create our own forecast system that is not terribly bad!


