
Beginners’ Guide To A Non-Technical Time Series Analysis For Web Traffic
Have you ever looked at a graph for analytics and wonder how this set of information can be useful to you and your organization? Has your boss ever asked you to be more data-driven and support your claims with data? Have you ever felt lost looking at big data? Well, I do and sometimes I still feel this way. With 99% of respondents for a survey, in various firms trying to move towards a data-driven culture and only one-third of them actually succeeding, the reality is that more effort is needed to bridge the gap in being more data literate.
Having worked at a few multinational companies in various industries and analyzing their websites to make sense of their web traffic, I derived a few lessons that can be applied generally to the majority of websites. If you have just started out in web analytics, this will be helpful to you.
What is a time series analysis?
Time series analysis is the collection of data at specific intervals over a period of time, with the purpose of identifying trends, cycles, and seasonal variances to aid in the forecasting of a future event. The data is historical and has 3 main use cases:
1. Descriptive Analytics — Trying to make sense of what has happened
2. Predictive Analytics — Trying to predict what will happen in the future based on what was observed in the past
3. Prescriptive Analytics — Trying to make use of data to help navigate future events (e.g. fraud detection). In this guide, we will be focusing on 1 & 2 (Descriptive Analytics and Predictive Analytics).
When applying descriptive analytics & predictive analytics to website traffic, it can bring about insights that help optimize web performance, improve key performance indicators and potentially identify suspicious web activity.
Many people tend to jump into the bandwagon of cool machine learning projects, tackling the predictive and prescriptive aspects, occasionally omitting descriptive analytics. But descriptive analytics may actually be the most crucial first step to take in any analytics project, which is to understand what happened in the past.
One of the challenges faced when doing descriptive analytics is not knowing where to start. Thus I will be sharing a simple approach that you could use to kickstart your journey in discovering what has happened in the past.
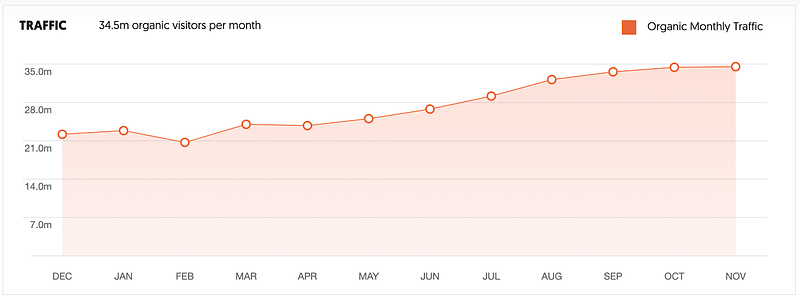
Estimated web traffic of medium.com 2019
The macro to micro approach
First, by looking at the overall traffic of the website for months in the year, it gives a macro view of where most web traffic is at. After looking at it from a macro point of view, you would then use indicators to help drill down (micro view) to a specific time granularity or web page, to have a clearer picture of the different components that might be contributing to a hypothesis you might have in mind. By going from macro to micro, it helps you identify the factors/activities that have the greatest impact on your web traffic. This allows you to be more effective when you uncover insights, giving you better returns on your time & effort.
Macro view
When looking at the overall traffic of a website, there are two main things to ask.
First, is the web traffic aligned to the strategy of the organization? If the organization is expanding and adopting an acquisition strategy, ideally, you would want to see an increase in web traffic. This shows an alignment of the web traffic with the organization’s strategy.
Second, are the key performance indicators (KPI) met? Meeting the organization’s KPI for web traffic would mean that the department is hitting its targets and good things come to those who hit their targets!
What to look out for?
By utilizing the 5 indicators below, you will be able to start picking out areas to begin analysis. The 5 indicators are -
- No change in traffic (consistent)
- An increase
- A decrease
- Patterns/Trends — Data follows a set of rules or a sequence of increase/decrease
- Spikes/Abnormalities — A sudden, usually sharp increase/decrease
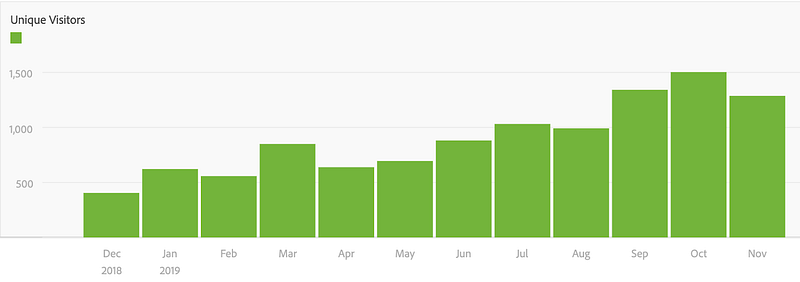
For the context of this guide (in the next few visualizations), we will be looking at the web traffic of an organization’s (Business to Business) website in the tech industry.
Time granularities and the possible hypothesis
Months in a year
In the time granularity for months in a year, there are two distinct trends you can look out for when comparing the different years. They are the seasonal trend and cyclical trend.
The seasonal trend is a characteristic in a time series whereby the data experiences regular and predictable changes that recur every calendar year, it can be something as simple as December having less traffic due to more people going on holidays.
Cyclical trends, on the other hand, are similar to a seasonal trend, except that it is in cycles where the period in between is not constant. An example of this is the cycle of technology advancement and how different technology in a product makes it obsolete faster or slower.
Days in a month
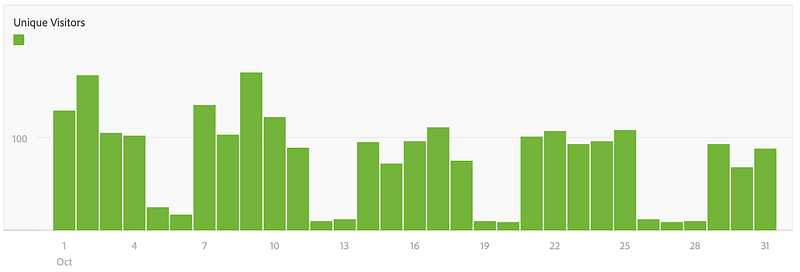
In the time granularity of days in a month, there are 3 activities you can look out for that might affect web traffic. The 3 are campaigns, news, and events.
Campaigns can come in various forms and are usually within control or scalable. It can be online or offline (sometimes both), a marketing campaign to drive traffic to your website or even a campaign to get people to engage with content more often. Depending on the campaign objectives, it can affect web traffic accordingly. It is good practice to note down any campaigns that are happening so that it can be properly attributed to the respective web traffic to measure effectiveness (pro tip: experiment holding campaigns at different lengths of period & days of the week). In the visualization above, it is not wise to hold an engagement campaign online during the days where the unique visitors are low (e.g. 12 & 13 Oct) because the returns would not be desirable compared to holding the engagement campaign at busier days (e.g. 2 & 9 Oct).
News is information that is released by the media, organizations or people on any channel that might directly or indirectly mention your organization/people/product or services. The timing of the release is usually uncontrollable but companies can influence it to a certain extent through press releases and embargoing information until certain dates. Do check the news as you might be surprised how certain spikes in web traffic may be attributable to them.
Events are usually planned and can take place in various channels. It is similar to campaigns but is usually a subset of a campaign and have a shorter duration. In the visualization above for the web traffic of days in a month, there was an event on 2 Oct, which lead to a spike in web traffic. By taking note of the event landing page traffic, it can be compared with similar future events to check for effectiveness (pro tip: experiment holding events at different days of the week).
I am sure you have noticed the obvious dip in web traffic for 2 days after every 5 days… Can you guess why? (hint: check the calendar for October 2019!).
If you enjoyed figuring out the first question, here is another that requires a little more investigative work. Why do you think there is an additional dip in web traffic on 28 October? (hint: check the Singapore calendar for October 2019!)
Knowing why there are certain peaks and troughs(pro tip: find out the cause and replicate/resolve them if possible) would help with operations planning, allowing your organization to be more efficient!
Hours in a day
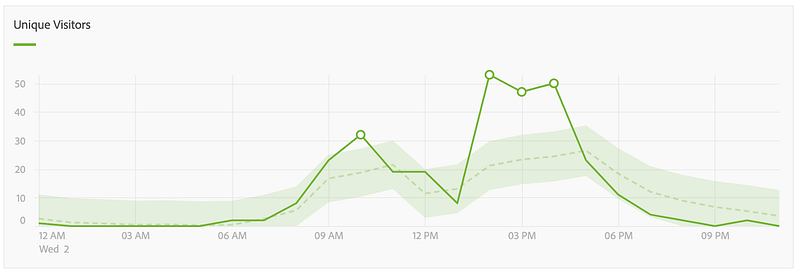
In the time granularity of hours in a day, you can find these 5 activities influencing the web traffic. The 5 activities are campaigns, events, news, maintenance, and suspicious web traffic.
Campaigns can take place over a longer period of weeks or as short as a block of hours in a day. It is good practice to note down the timing where the campaigns are active, to attribute it and measure its effectiveness (pro tip: experiment holding campaigns at different hours of the day).
Similarly to campaigns, events can take place over a period of a few days, it is also good practice to note down the timing when the events are happening to attribute it and measure its effectiveness. In the visualization above, a spike can be seen around 2–4 pm, compared to the day before (dotted trend line). This is because there was an actual event on 2 October, during that timing and participants were encouraged to visit the website (pro tip: experiment holding events at different hours of the day).
News is mostly uncontrollable but it is still good to know where the source is from and understand how it impacted your organization’s web traffic. By checking what time of the day the spike of traffic is at, you can differentiate between an event (your organization won’t hold a local event at 4 am) and news from a foreign country in a different time zone!
Maintenance can be planned or your website might just be down (my software developer colleagues’ hearts always skip a beat when I yell it out across the office). Usually, you will see a drastic drop in traffic during that time window. The best practice here would be to hold maintenance at hours where there is the least traffic and note down any maintenance so that the dip in traffic can be properly attributed. In a worst-case scenario, the website might crash/go on maintenance multiple times over a few days and this might severely affect your web traffic KPI for the month. Hence, making it more important to record it so as to explain why the KPI or targets were not met.
Suspicious web traffic might occur when there are spikes of web traffic in certain timings. It might be an attempt to conduct a Distributed Denial of Service (DDoS) attack on your website. These spikes should be investigated and reported to your cybersecurity team where necessary.
This guide has given you an idea of where and what to start looking out for in the analysis of your website’s performance. There are many uncontrollable factors influencing your web traffic and you might not be able to accurately identify and attribute them. Hence, having a good understanding of the industry, your organization and its processes will give you an edge in solving some of the mysteries or even predicting them (descriptive & predictive analytics). I hope that you have taken away something useful from this guide. Good luck and happy investigating!
If you found this article interesting or helpful, do share it so that you can help others learn too.


