Display Customizations for pandas Power Users
pandas display customizations are often overlooked part of pandas. Many users don’t know that they can customize display-related options.

pandas has an options system that lets you customize some aspects of its behavior, display-related options being those the user is most likely to adjust.
pandas display customizations are often overlooked part of pandas. For most users, defaults are good enough, but many users don’t know about display customizations and they find some alternative cumbersome method to overcome them. To become a pandas expert you should at least know about the display customization options.
Here are a few links that might interest you:
- Labeling and Data Engineering for Conversational AI and Analytics- Data Science for Business Leaders [Course]- Intro to Machine Learning with PyTorch [Course]- Become a Growth Product Manager [Course]- Deep Learning (Adaptive Computation and ML series) [Ebook]- Free skill tests for Data Scientists & Machine Learning EngineersSome of the links above are affiliate links and if you go through them to make a purchase I’ll earn a commission. Keep in mind that I link courses because of their quality and not because of the commission I receive from your purchases.
To Step Up Your Pandas Game, read:
Setup
import os
import platform
from platform import python_version
import jupyterlab
import pandas as pd
import randomprint("System")
print("os name: %s" % os.name)
print("system: %s" % platform.system())
print("release: %s" % platform.release())
print()
print("Python")
print("version: %s" % python_version())
print()
print("Python Packages")
print("jupterlab==%s" % jupyterlab.__version__)
print("pandas==%s" % pd.__version__)seed = 42
random.seed(seed)
pd.np.random.seed(seed)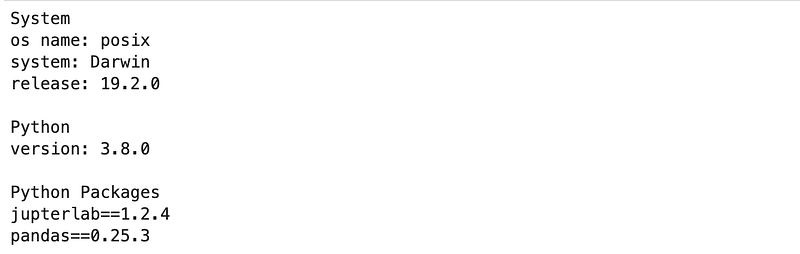
Let’s define the dataset. It has 100 rows and 2 columns:
- col1 has random numbers between 0 and 1,
- col2 has random sentences composed of 200 characters.
def generate_sentence(n_chars=200):
    return ''.join(random.choice('abcdefg ') for _ in range(n_chars))
n = 100
df = pd.DataFrame(
{
"col1": pd.np.random.random_sample(n),
"text": [generate_sentence() for _ in range(n)]
}
)
df.shape(100, 2)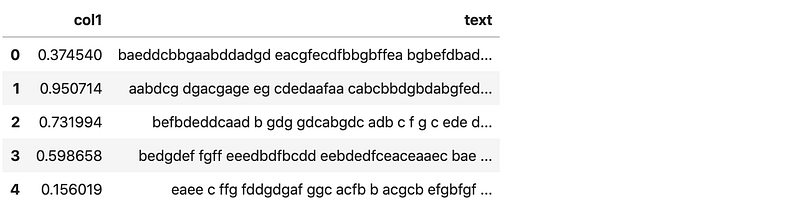
Suppress scientific notation
By default, pandas displays small and large numbers in scientific (exponential) notation. If the scientific notation is not your preferred format, you can disable it with a single command.
Let’s replace the first value in col1 with a small number. pandas is forced to display col1 in scientific notation because of a small number.
df.iloc[0, 0] = 1e-10df.head()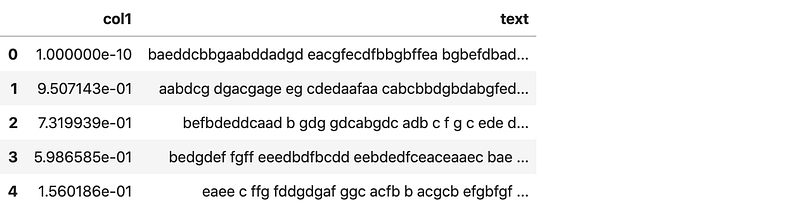
With float_format we can set the number of decimal places we would like to display (10 in the example below).
pd.options.display.float_format = '{:,.10f}'.formatdf.head()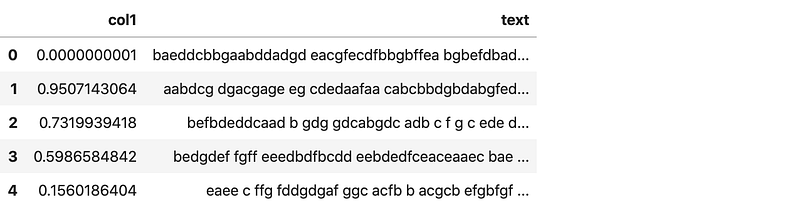
With reset_option command, we reset it back to scientific notation.
pd.reset_option('display.float_format')Max columns/rows to display
When working with bigger datasets we notice that pandas doesn’t display all columns or rows. Obviously, this is for performance reasons. While I don’t mind hiding rows, it can get frustrating by not seeing all the columns (20 is the default limit).
Let’s transform rows to columns to visualize the problem first hand.
df.T
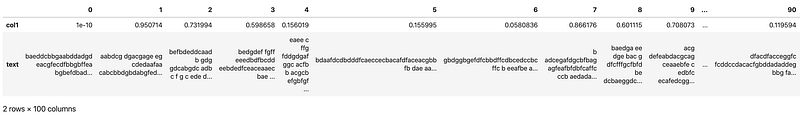
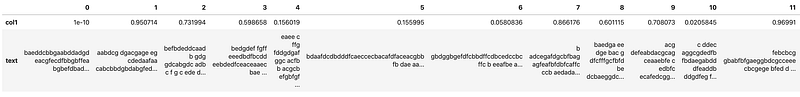
Now, let’s set max columns to 100.
pd.set_option("display.max_columns", 100)df.T
To reset the max columns display, we can set it back to 20.
pd.set_option("display.max_columns", 20)Pandas also has a get option to see, which value is currently set.
pd.get_option('display.max_columns')20
We can do the same with display.max_rows for rows.
Expand the column width
Usually, when working with textual data, strings are only partially visible because of its length. Pandas enables us to increase the column width with max_colwidth option.
pd.set_option('max_colwidth', 500)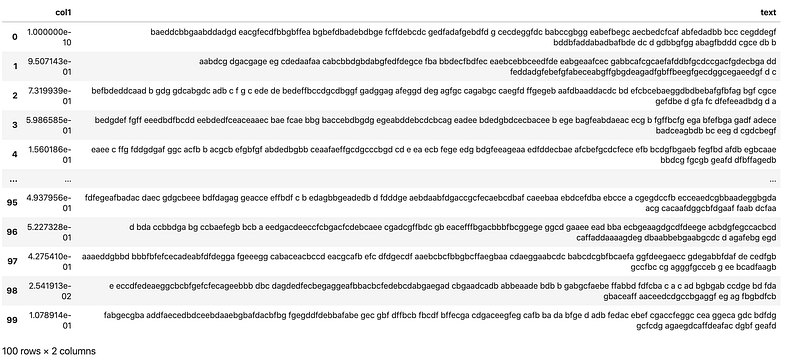
DataFrame Info
I am sure you are familiar with describe function with outputs summary statistics for each column in the DataFrame. The info option is like meta describe function, because it outputs metadata for the DataFrame, like data types, non-null objects, and memory usage.
This is useful when working with large datasets.
pd.set_option('large_repr', 'info')df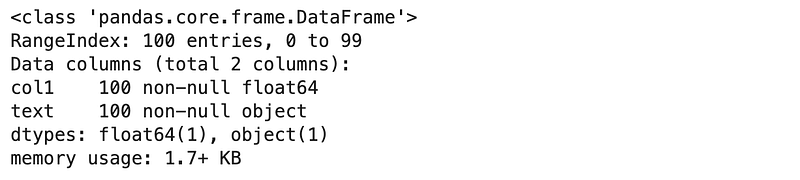
pd.reset_option('large_repr') # reset itConclusion
These were the most frequently used pandas display customizations. If you would like to learn more about display customizations read Options and settings section of pandas documentation.
Before you go
Follow me on Twitter, where I regularly tweet about Data Science and Machine Learning.